

State of the World's Children 2013 - Unicef
State of the World's Children 2013 - Unicef
State of the World's Children 2013 - Unicef

Create successful ePaper yourself
Turn your PDF publications into a flip-book with our unique Google optimized e-Paper software.
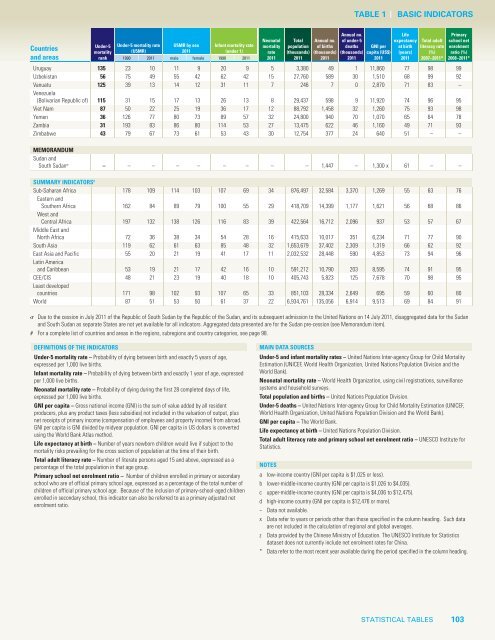
TABLE 1<br />
BASIC INdICATORS<br />
Countries<br />
and areas<br />
Under-5<br />
mortality<br />
rank<br />
Under-5 mortality rate<br />
(U5MR)<br />
U5MR by sex<br />
2011<br />
Infant mortality rate<br />
(under 1)<br />
1990 2011 male female 1990 2011<br />
Uruguay 135 23 10 11 9 20 9 5 3,380 49 1 11,860 77 98 99<br />
Uzbekistan 56 75 49 55 42 62 42 15 27,760 589 30 1,510 68 99 92<br />
Vanuatu 125 39 13 14 12 31 11 7 246 7 0 2,870 71 83 –<br />
Venezuela<br />
(Bolivarian Republic <strong>of</strong>) 115 31 15 17 13 26 13 8 29,437 598 9 11,920 74 96 95<br />
Viet Nam 87 50 22 25 19 36 17 12 88,792 1,458 32 1,260 75 93 98<br />
Yemen 36 126 77 80 73 89 57 32 24,800 940 70 1,070 65 64 78<br />
Zambia 31 193 83 86 80 114 53 27 13,475 622 46 1,160 49 71 93<br />
Zimbabwe 43 79 67 73 61 53 43 30 12,754 377 24 640 51 – –<br />
Neonatal<br />
mortality<br />
rate<br />
2011<br />
Total<br />
population<br />
(thousands)<br />
2011<br />
Annual no.<br />
<strong>of</strong> births<br />
(thousands)<br />
2011<br />
Annual no.<br />
<strong>of</strong> under-5<br />
deaths<br />
(thousands)<br />
2011<br />
GNI per<br />
capita (US$)<br />
2011<br />
Life<br />
expectancy<br />
at birth<br />
(years)<br />
2011<br />
Total adult<br />
literacy rate<br />
(%)<br />
2007–2011*<br />
Primary<br />
school net<br />
enrolment<br />
ratio (%)<br />
2008–2011*<br />
MEMORANDUM<br />
Sudan and<br />
South Sudan s – – – – – – – – – 1,447 – 1,300 x 61 – –<br />
SUMMARY INDICATORS #<br />
Sub-Saharan Africa 178 109 114 103 107 69 34 876,497 32,584 3,370 1,269 55 63 76<br />
Eastern and<br />
Sou<strong>the</strong>rn Africa 162 84 89 79 100 55 29 418,709 14,399 1,177 1,621 56 68 86<br />
West and<br />
Central Africa 197 132 138 126 116 83 39 422,564 16,712 2,096 937 53 57 67<br />
Middle East and<br />
North Africa 72 36 38 34 54 28 16 415,633 10,017 351 6,234 71 77 90<br />
South Asia 119 62 61 63 85 48 32 1,653,679 37,402 2,309 1,319 66 62 92<br />
East Asia and Pacific 55 20 21 19 41 17 11 2,032,532 28,448 590 4,853 73 94 96<br />
Latin America<br />
and Caribbean 53 19 21 17 42 16 10 591,212 10,790 203 8,595 74 91 95<br />
CEE/CIS 48 21 23 19 40 18 10 405,743 5,823 125 7,678 70 98 95<br />
Least developed<br />
countries 171 98 102 93 107 65 33 851,103 28,334 2,649 695 59 60 80<br />
World 87 51 53 50 61 37 22 6,934,761 135,056 6,914 9,513 69 84 91<br />
s Due to <strong>the</strong> cession in July 2011 <strong>of</strong> <strong>the</strong> Republic <strong>of</strong> South Sudan by <strong>the</strong> Republic <strong>of</strong> <strong>the</strong> Sudan, and its subsequent admission to <strong>the</strong> United Nations on 14 July 2011, disaggregated data for <strong>the</strong> Sudan<br />
and South Sudan as separate <strong>State</strong>s are not yet available for all indicators. Aggregated data presented are for <strong>the</strong> Sudan pre-cession (see Memorandum item).<br />
# For a complete list <strong>of</strong> countries and areas in <strong>the</strong> regions, subregions and country categories, see page 98.<br />
DEFINITIONS OF THE INDICATORS<br />
Under-5 mortality rate – Probability <strong>of</strong> dying between birth and exactly 5 years <strong>of</strong> age,<br />
expressed per 1,000 live births.<br />
Infant mortality rate – Probability <strong>of</strong> dying between birth and exactly 1 year <strong>of</strong> age, expressed<br />
per 1,000 live births.<br />
Neonatal mortality rate – Probability <strong>of</strong> dying during <strong>the</strong> first 28 completed days <strong>of</strong> life,<br />
expressed per 1,000 live births.<br />
GNI per capita – Gross national income (GNI) is <strong>the</strong> sum <strong>of</strong> value added by all resident<br />
producers, plus any product taxes (less subsidies) not included in <strong>the</strong> valuation <strong>of</strong> output, plus<br />
net receipts <strong>of</strong> primary income (compensation <strong>of</strong> employees and property income) from abroad.<br />
GNI per capita is GNI divided by midyear population. GNI per capita in US dollars is converted<br />
using <strong>the</strong> World Bank Atlas method.<br />
Life expectancy at birth – Number <strong>of</strong> years newborn children would live if subject to <strong>the</strong><br />
mortality risks prevailing for <strong>the</strong> cross section <strong>of</strong> population at <strong>the</strong> time <strong>of</strong> <strong>the</strong>ir birth.<br />
Total adult literacy rate – Number <strong>of</strong> literate persons aged 15 and above, expressed as a<br />
percentage <strong>of</strong> <strong>the</strong> total population in that age group.<br />
Primary school net enrolment ratio – Number <strong>of</strong> children enrolled in primary or secondary<br />
school who are <strong>of</strong> <strong>of</strong>ficial primary school age, expressed as a percentage <strong>of</strong> <strong>the</strong> total number <strong>of</strong><br />
children <strong>of</strong> <strong>of</strong>ficial primary school age. Because <strong>of</strong> <strong>the</strong> inclusion <strong>of</strong> primary-school-aged children<br />
enrolled in secondary school, this indicator can also be referred to as a primary adjusted net<br />
enrolment ratio.<br />
MAIN DATA SOURCES<br />
Under-5 and infant mortality rates – United Nations Inter-agency Group for Child Mortality<br />
Estimation (UNICEF, World Health Organization, United Nations Population Division and <strong>the</strong><br />
World Bank).<br />
Neonatal mortality rate – World Health Organization, using civil registrations, surveillance<br />
systems and household surveys.<br />
Total population and births – United Nations Population Division.<br />
Under-5 deaths – United Nations Inter-agency Group for Child Mortality Estimation (UNICEF,<br />
World Health Organization, United Nations Population Division and <strong>the</strong> World Bank).<br />
GNI per capita – The World Bank.<br />
Life expectancy at birth – United Nations Population Division.<br />
Total adult literacy rate and primary school net enrolment ratio – UNESCO Institute for<br />
Statistics.<br />
NOTES<br />
a low-income country (GNI per capita is $1,025 or less).<br />
b lower-middle-income country (GNI per capita is $1,026 to $4,035).<br />
c upper-middle-income country (GNI per capita is $4,036 to $12,475).<br />
d high-income country (GNI per capita is $12,476 or more).<br />
− Data not available.<br />
x Data refer to years or periods o<strong>the</strong>r than those specified in <strong>the</strong> column heading. Such data<br />
are not included in <strong>the</strong> calculation <strong>of</strong> regional and global averages.<br />
z Data provided by <strong>the</strong> Chinese Ministry <strong>of</strong> Education. The UNESCO Institute for Statistics<br />
dataset does not currently include net enrolment rates for China.<br />
* Data refer to <strong>the</strong> most recent year available during <strong>the</strong> period specified in <strong>the</strong> column heading.<br />
STATISTICAL TABLES 103


