

State of the World's Children 2013 - Unicef
State of the World's Children 2013 - Unicef
State of the World's Children 2013 - Unicef

You also want an ePaper? Increase the reach of your titles
YUMPU automatically turns print PDFs into web optimized ePapers that Google loves.
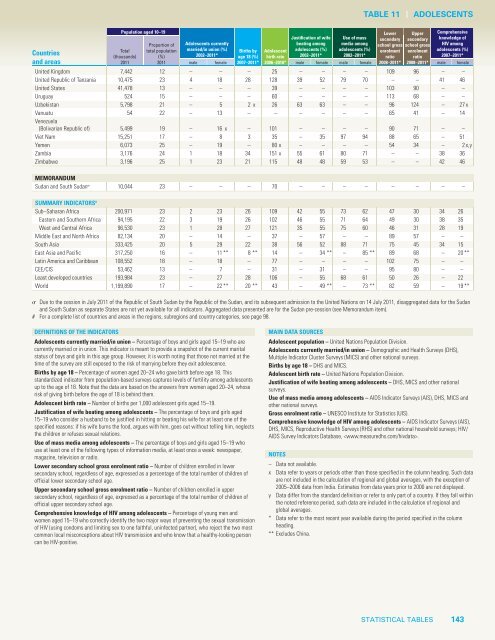
TABLE 11<br />
AdOLESCENTS<br />
Countries<br />
and areas<br />
Justification <strong>of</strong> wife Use <strong>of</strong> mass<br />
Lower<br />
secondary<br />
Upper<br />
secondary<br />
Comprehensive<br />
knowledge <strong>of</strong><br />
Proportion <strong>of</strong> Adolescents currently<br />
beating among media among school gross school gross HIV among<br />
total population<br />
(%)<br />
married/in union (%)<br />
2002–2011*<br />
Births by<br />
age 18 (%)<br />
Adolescent<br />
birth rate<br />
adolescents (%)<br />
2002–2011*<br />
adolescents (%)<br />
2002–2011*<br />
enrolment<br />
ratio<br />
enrolment<br />
ratio<br />
adolescents (%)<br />
2007–2011*<br />
2011 male female 2007–2011* 2006–2010* male female male female 2008–2011* 2008–2011* male female<br />
Population aged 10–19<br />
Total<br />
(thousands)<br />
2011<br />
United Kingdom 7,442 12 – – – 25 – – – – 109 96 – –<br />
United Republic <strong>of</strong> Tanzania 10,475 23 4 18 28 128 39 52 79 70 – – 41 46<br />
United <strong>State</strong>s 41,478 13 – – – 39 – – – – 103 90 – –<br />
Uruguay 524 15 – – – 60 – – – – 113 68 – –<br />
Uzbekistan 5,798 21 – 5 2 x 26 63 63 – – 96 124 – 27 x<br />
Vanuatu 54 22 – 13 – – – – – – 65 41 – 14<br />
Venezuela<br />
(Bolivarian Republic <strong>of</strong>) 5,499 19 – 16 x – 101 – – – – 90 71 – –<br />
Viet Nam 15,251 17 – 8 3 35 – 35 97 94 88 65 – 51<br />
Yemen 6,073 25 – 19 – 80 x – – – – 54 34 – 2 x, y<br />
Zambia 3,176 24 1 18 34 151 x 55 61 80 71 – – 38 36<br />
Zimbabwe 3,196 25 1 23 21 115 48 48 59 53 – – 42 46<br />
MEMORANDUM<br />
Sudan and South Sudan s 10,044 23 – – – 70 – – – – – – – –<br />
SUMMARY INDICATORS #<br />
Sub–Saharan Africa 200,971 23 2 23 26 109 42 55 73 62 47 30 34 26<br />
Eastern and Sou<strong>the</strong>rn Africa 94,195 22 3 19 26 102 46 55 71 64 49 30 38 35<br />
West and Central Africa 96,530 23 1 28 27 121 35 55 75 60 46 31 28 19<br />
Middle East and North Africa 82,134 20 – 14 – 37 – 57 – – 89 57 – –<br />
South Asia 333,425 20 5 29 22 38 56 52 88 71 75 45 34 15<br />
East Asia and Pacific 317,250 16 – 11 ** 8 ** 14 – 34 ** – 85 ** 89 68 – 20 **<br />
Latin America and Caribbean 108,552 18 – 18 – 77 – – – – 102 75 – –<br />
CEE/CIS 53,462 13 – 7 – 31 – 31 – – 95 80 – –<br />
Least developed countries 193,984 23 – 27 28 106 – 55 68 61 50 26 – 22<br />
World 1,199,890 17 – 22 ** 20 ** 43 – 49 ** – 73 ** 82 59 – 19 **<br />
s Due to <strong>the</strong> cession in July 2011 <strong>of</strong> <strong>the</strong> Republic <strong>of</strong> South Sudan by <strong>the</strong> Republic <strong>of</strong> <strong>the</strong> Sudan, and its subsequent admission to <strong>the</strong> United Nations on 14 July 2011, disaggregated data for <strong>the</strong> Sudan<br />
and South Sudan as separate <strong>State</strong>s are not yet available for all indicators. Aggregated data presented are for <strong>the</strong> Sudan pre-cession (see Memorandum item).<br />
# For a complete list <strong>of</strong> countries and areas in <strong>the</strong> regions, subregions and country categories, see page 98.<br />
DEFINITIONS OF THE INDICATORS<br />
Adolescents currently married/in union – Percentage <strong>of</strong> boys and girls aged 15–19 who are<br />
currently married or in union. This indicator is meant to provide a snapshot <strong>of</strong> <strong>the</strong> current marital<br />
status <strong>of</strong> boys and girls in this age group. However, it is worth noting that those not married at <strong>the</strong><br />
time <strong>of</strong> <strong>the</strong> survey are still exposed to <strong>the</strong> risk <strong>of</strong> marrying before <strong>the</strong>y exit adolescence.<br />
Births by age 18 – Percentage <strong>of</strong> women aged 20–24 who gave birth before age 18. This<br />
standardized indicator from population-based surveys captures levels <strong>of</strong> fertility among adolescents<br />
up to <strong>the</strong> age <strong>of</strong> 18. Note that <strong>the</strong> data are based on <strong>the</strong> answers from women aged 20–24, whose<br />
risk <strong>of</strong> giving birth before <strong>the</strong> age <strong>of</strong> 18 is behind <strong>the</strong>m.<br />
Adolescent birth rate – Number <strong>of</strong> births per 1,000 adolescent girls aged 15–19.<br />
Justification <strong>of</strong> wife beating among adolescents – The percentage <strong>of</strong> boys and girls aged<br />
15–19 who consider a husband to be justified in hitting or beating his wife for at least one <strong>of</strong> <strong>the</strong><br />
specified reasons: if his wife burns <strong>the</strong> food, argues with him, goes out without telling him, neglects<br />
<strong>the</strong> children or refuses sexual relations.<br />
Use <strong>of</strong> mass media among adolescents – The percentage <strong>of</strong> boys and girls aged 15–19 who<br />
use at least one <strong>of</strong> <strong>the</strong> following types <strong>of</strong> information media, at least once a week: newspaper,<br />
magazine, television or radio.<br />
Lower secondary school gross enrolment ratio – Number <strong>of</strong> children enrolled in lower<br />
secondary school, regardless <strong>of</strong> age, expressed as a percentage <strong>of</strong> <strong>the</strong> total number <strong>of</strong> children <strong>of</strong><br />
<strong>of</strong>ficial lower secondary school age.<br />
Upper secondary school gross enrolment ratio – Number <strong>of</strong> children enrolled in upper<br />
secondary school, regardless <strong>of</strong> age, expressed as a percentage <strong>of</strong> <strong>the</strong> total number <strong>of</strong> children <strong>of</strong><br />
<strong>of</strong>ficial upper secondary school age.<br />
Comprehensive knowledge <strong>of</strong> HIV among adolescents – Percentage <strong>of</strong> young men and<br />
women aged 15–19 who correctly identify <strong>the</strong> two major ways <strong>of</strong> preventing <strong>the</strong> sexual transmission<br />
<strong>of</strong> HIV (using condoms and limiting sex to one faithful, uninfected partner), who reject <strong>the</strong> two most<br />
common local misconceptions about HIV transmission and who know that a healthy-looking person<br />
can be HIV-positive.<br />
MAIN DATA SOURCES<br />
Adolescent population – United Nations Population Division.<br />
Adolescents currently married/in union – Demographic and Health Surveys (DHS),<br />
Multiple Indicator Cluster Surveys (MICS) and o<strong>the</strong>r national surveys.<br />
Births by age 18 – DHS and MICS.<br />
Adolescent birth rate – United Nations Population Division.<br />
Justification <strong>of</strong> wife beating among adolescents – DHS, MICS and o<strong>the</strong>r national<br />
surveys.<br />
Use <strong>of</strong> mass media among adolescents – AIDS Indicator Surveys (AIS), DHS, MICS and<br />
o<strong>the</strong>r national surveys.<br />
Gross enrolment ratio – UNESCO Institute for Statistics (UIS).<br />
Comprehensive knowledge <strong>of</strong> HIV among adolescents – AIDS Indicator Surveys (AIS),<br />
DHS, MICS, Reproductive Health Surveys (RHS) and o<strong>the</strong>r national household surveys; HIV/<br />
AIDS Survey Indicators Database, .<br />
NOTES<br />
– Data not available.<br />
x Data refer to years or periods o<strong>the</strong>r than those specified in <strong>the</strong> column heading. Such data<br />
are not included in <strong>the</strong> calculation <strong>of</strong> regional and global averages, with <strong>the</strong> exception <strong>of</strong><br />
2005–2006 data from India. Estimates from data years prior to 2000 are not displayed.<br />
y Data differ from <strong>the</strong> standard definition or refer to only part <strong>of</strong> a country. If <strong>the</strong>y fall within<br />
<strong>the</strong> noted reference period, such data are included in <strong>the</strong> calculation <strong>of</strong> regional and<br />
global averages.<br />
* Data refer to <strong>the</strong> most recent year available during <strong>the</strong> period specified in <strong>the</strong> column<br />
heading.<br />
** Excludes China.<br />
STATISTICAL TABLES 143


