

State of the World's Children 2013 - Unicef
State of the World's Children 2013 - Unicef
State of the World's Children 2013 - Unicef

You also want an ePaper? Increase the reach of your titles
YUMPU automatically turns print PDFs into web optimized ePapers that Google loves.
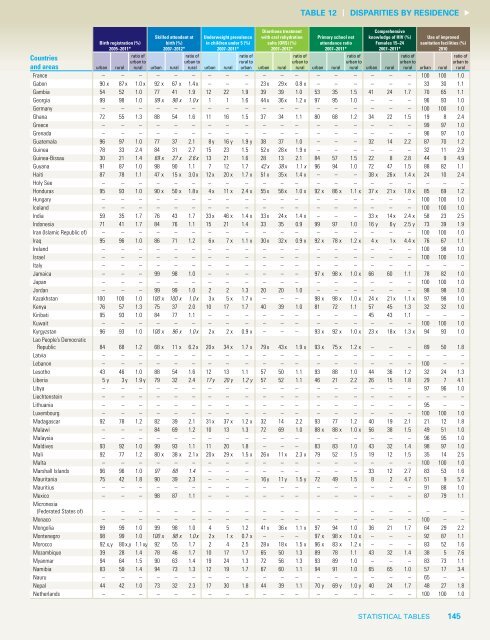
TABLE 12<br />
disparities by residence<br />
Countries<br />
Birth registration (%)<br />
2005–2011*<br />
Skilled attendant at<br />
birth (%)<br />
2007–2012*<br />
ratio <strong>of</strong><br />
urban to<br />
rural urban rural<br />
Underweight prevalence<br />
in children under 5 (%)<br />
2007–2011*<br />
ratio <strong>of</strong><br />
urban to<br />
rural urban rural<br />
Diarrhoea treatment<br />
with oral rehydration<br />
salts (ORS) (%)<br />
2007−2012*<br />
ratio <strong>of</strong><br />
rural to<br />
urban urban rural<br />
Primary school net<br />
attendance ratio<br />
2007−2011*<br />
ratio <strong>of</strong><br />
urban to<br />
rural urban rural<br />
Comprehensive<br />
knowledge <strong>of</strong> HIV (%)<br />
Females 15−24<br />
2007−2011*<br />
ratio <strong>of</strong><br />
urban to<br />
rural urban rural<br />
Use <strong>of</strong> improved<br />
sanitation facilities (%)<br />
2010<br />
ratio <strong>of</strong><br />
urban to<br />
rural urban rural<br />
and areas<br />
urban rural<br />
France – – – – – – – – – – – – – – – – – – 100 100 1.0<br />
Gabon 90 x 87 x 1.0 x 92 x 67 x 1.4 x – – – 23 x 29 x 0.8 x – – – – – – 33 30 1.1<br />
Gambia 54 52 1.0 77 41 1.9 12 22 1.9 39 39 1.0 53 35 1.5 41 24 1.7 70 65 1.1<br />
Georgia 99 98 1.0 99 x 98 x 1.0 x 1 1 1.6 44 x 36 x 1.2 x 97 95 1.0 – – – 96 93 1.0<br />
Germany – – – – – – – – – – – – – – – – – – 100 100 1.0<br />
Ghana 72 55 1.3 88 54 1.6 11 16 1.5 37 34 1.1 80 68 1.2 34 22 1.5 19 8 2.4<br />
Greece – – – – – – – – – – – – – – – – – – 99 97 1.0<br />
Grenada – – – – – – – – – – – – – – – – – – 96 97 1.0<br />
Guatemala 96 97 1.0 77 37 2.1 8 y 16 y 1.9 y 38 37 1.0 – – – 32 14 2.2 87 70 1.2<br />
Guinea 78 33 2.4 84 31 2.7 15 23 1.5 52 x 28 x 1.9 x – – – – – – 32 11 2.9<br />
Guinea-Bissau 30 21 1.4 69 x 27 x 2.6 x 13 21 1.6 28 13 2.1 84 57 1.5 22 8 2.8 44 9 4.9<br />
Guyana 91 87 1.0 98 90 1.1 7 12 1.7 42 x 38 x 1.1 x 96 94 1.0 72 47 1.5 88 82 1.1<br />
Haiti 87 78 1.1 47 x 15 x 3.0 x 12 x 20 x 1.7 x 51 x 35 x 1.4 x – – – 38 x 26 x 1.4 x 24 10 2.4<br />
Holy See – – – – – – – – – – – – – – – – – – – – –<br />
Honduras 95 93 1.0 90 x 50 x 1.8 x 4 x 11 x 2.4 x 55 x 56 x 1.0 x 92 x 86 x 1.1 x 37 x 21 x 1.8 x 85 69 1.2<br />
Hungary – – – – – – – – – – – – – – – – – – 100 100 1.0<br />
Iceland – – – – – – – – – – – – – – – – – – 100 100 1.0<br />
India 59 35 1.7 76 43 1.7 33 x 46 x 1.4 x 33 x 24 x 1.4 x – – – 33 x 14 x 2.4 x 58 23 2.5<br />
Indonesia 71 41 1.7 84 76 1.1 15 21 1.4 33 35 0.9 99 97 1.0 16 y 6 y 2.5 y 73 39 1.9<br />
Iran (Islamic Republic <strong>of</strong>) – – – – – – – – – – – – – – – – – – 100 100 1.0<br />
Iraq 95 96 1.0 86 71 1.2 6 x 7 x 1.1 x 30 x 32 x 0.9 x 92 x 78 x 1.2 x 4 x 1 x 4.4 x 76 67 1.1<br />
Ireland – – – – – – – – – – – – – – – – – – 100 98 1.0<br />
Israel – – – – – – – – – – – – – – – – – – 100 100 1.0<br />
Italy – – – – – – – – – – – – – – – – – – – – –<br />
Jamaica – – – 99 98 1.0 – – – – – – 97 x 98 x 1.0 x 66 60 1.1 78 82 1.0<br />
Japan – – – – – – – – – – – – – – – – – – 100 100 1.0<br />
Jordan – – – 99 99 1.0 2 2 1.3 20 20 1.0 – – – – – – 98 98 1.0<br />
Kazakhstan 100 100 1.0 100 x 100 x 1.0 x 3 x 5 x 1.7 x – – – 98 x 98 x 1.0 x 24 x 21 x 1.1 x 97 98 1.0<br />
Kenya 76 57 1.3 75 37 2.0 10 17 1.7 40 39 1.0 81 72 1.1 57 45 1.3 32 32 1.0<br />
Kiribati 95 93 1.0 84 77 1.1 – – – – – – – – – 45 43 1.1 – – –<br />
Kuwait – – – – – – – – – – – – – – – – – – 100 100 1.0<br />
Kyrgyzstan 96 93 1.0 100 x 96 x 1.0 x 2 x 2 x 0.9 x – – – 93 x 92 x 1.0 x 23 x 18 x 1.3 x 94 93 1.0<br />
Lao People’s Democratic<br />
Republic 84 68 1.2 68 x 11 x 6.2 x 20 x 34 x 1.7 x 79 x 43 x 1.9 x 93 x 75 x 1.2 x – – – 89 50 1.8<br />
Latvia – – – – – – – – – – – – – – – – – – – – –<br />
Lebanon – – – – – – – – – – – – – – – – – – 100 – –<br />
Lesotho 43 46 1.0 88 54 1.6 12 13 1.1 57 50 1.1 93 88 1.0 44 36 1.2 32 24 1.3<br />
Liberia 5 y 3 y 1.9 y 79 32 2.4 17 y 20 y 1.2 y 57 52 1.1 46 21 2.2 26 15 1.8 29 7 4.1<br />
Libya – – – – – – – – – – – – – – – – – – 97 96 1.0<br />
Liechtenstein – – – – – – – – – – – – – – – – – – – – –<br />
Lithuania – – – – – – – – – – – – – – – – – – 95 – –<br />
Luxembourg – – – – – – – – – – – – – – – – – – 100 100 1.0<br />
Madagascar 92 78 1.2 82 39 2.1 31 x 37 x 1.2 x 32 14 2.2 93 77 1.2 40 19 2.1 21 12 1.8<br />
Malawi – – – 84 69 1.2 10 13 1.3 72 69 1.0 88 x 88 x 1.0 x 56 38 1.5 49 51 1.0<br />
Malaysia – – – – – – – – – – – – – – – – – – 96 95 1.0<br />
Maldives 93 92 1.0 99 93 1.1 11 20 1.8 – – – 83 83 1.0 43 32 1.4 98 97 1.0<br />
Mali 92 77 1.2 80 x 38 x 2.1 x 20 x 29 x 1.5 x 26 x 11 x 2.3 x 79 52 1.5 19 12 1.5 35 14 2.5<br />
Malta – – – – – – – – – – – – – – – – – – 100 100 1.0<br />
Marshall Islands 96 96 1.0 97 68 1.4 – – – – – – – – – 33 12 2.7 83 53 1.6<br />
Mauritania 75 42 1.8 90 39 2.3 – – – 16 y 11 y 1.5 y 72 49 1.5 8 2 4.7 51 9 5.7<br />
Mauritius – – – – – – – – – – – – – – – – – – 91 88 1.0<br />
Mexico – – – 98 87 1.1 – – – – – – – – – – – – 87 79 1.1<br />
Micronesia<br />
(Federated <strong>State</strong>s <strong>of</strong>) – – – – – – – – – – – – – – – – – – – – –<br />
Monaco – – – – – – – – – – – – – – – – – – 100 – –<br />
Mongolia 99 99 1.0 99 98 1.0 4 5 1.2 41 x 36 x 1.1 x 97 94 1.0 36 21 1.7 64 29 2.2<br />
Montenegro 98 99 1.0 100 x 98 x 1.0 x 2 x 1 x 0.7 x – – – 97 x 98 x 1.0 x – – – 92 87 1.1<br />
Morocco 92 x,y 80 x,y 1.1 x,y 92 55 1.7 2 4 2.5 28 x 18 x 1.5 x 96 x 83 x 1.2 x – – – 83 52 1.6<br />
Mozambique 39 28 1.4 78 46 1.7 10 17 1.7 65 50 1.3 89 78 1.1 43 32 1.4 38 5 7.6<br />
Myanmar 94 64 1.5 90 63 1.4 19 24 1.3 72 56 1.3 93 89 1.0 – – – 83 73 1.1<br />
Namibia 83 59 1.4 94 73 1.3 12 19 1.7 67 60 1.1 94 91 1.0 65 65 1.0 57 17 3.4<br />
Nauru – – – – – – – – – – – – – – – – – – 65 – –<br />
Nepal 44 42 1.0 73 32 2.3 17 30 1.8 44 39 1.1 70 y 69 y 1.0 y 40 24 1.7 48 27 1.8<br />
Ne<strong>the</strong>rlands – – – – – – – – – – – – – – – – – – 100 100 1.0<br />
ratio <strong>of</strong><br />
urban to<br />
rural<br />
STATISTICAL TABLES 145


