

Adult Literacy in America - National Center for Education Statistics ...
Adult Literacy in America - National Center for Education Statistics ...
Adult Literacy in America - National Center for Education Statistics ...

Create successful ePaper yourself
Turn your PDF publications into a flip-book with our unique Google optimized e-Paper software.
88 ......Section III<br />
A second question based on this document — What is the current net<br />
pay? — was also expected to require readers to make a two-feature match.<br />
Accord<strong>in</strong>gly, the difficulty values of the two items were expected to be similar.<br />
The task anchored at about the 224 po<strong>in</strong>t on the scale, however, and an analysis<br />
of the pay stub reveals why its difficulty was lower than that of the previous<br />
task. To succeed on the second task, the reader only needs to match on the<br />
feature “net pay.” S<strong>in</strong>ce the term appears only once on the pay stub and there<br />
is only one number <strong>in</strong> the column, this task requires only a one-feature match<br />
and receives a difficulty value that lies with<strong>in</strong> the Level 1 range on the<br />
document scale.<br />
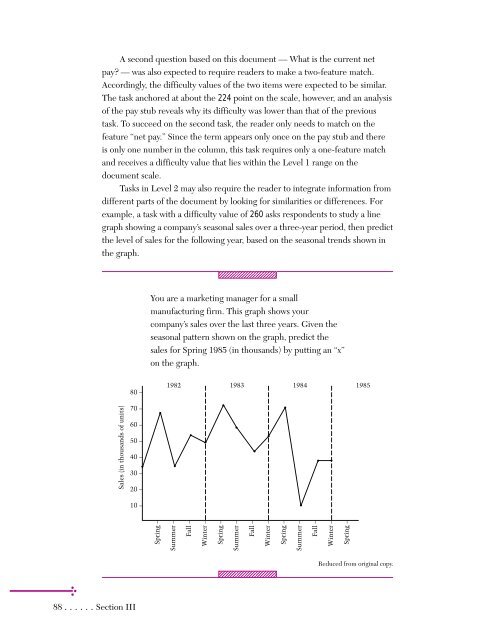
Tasks <strong>in</strong> Level 2 may also require the reader to <strong>in</strong>tegrate <strong>in</strong><strong>for</strong>mation from<br />
different parts of the document by look<strong>in</strong>g <strong>for</strong> similarities or differences. For<br />
example, a task with a difficulty value of 260 asks respondents to study a l<strong>in</strong>e<br />
graph show<strong>in</strong>g a company’s seasonal sales over a three-year period, then predict<br />
the level of sales <strong>for</strong> the follow<strong>in</strong>g year, based on the seasonal trends shown <strong>in</strong><br />
the graph.<br />
Sales (<strong>in</strong> thousands of units)<br />
80 –<br />
70 –<br />
60 –<br />
50 –<br />
40 –<br />
30 –<br />
20 –<br />
10 –<br />
1234567890123456789012<br />
1234567890123456789012<br />
1234567890123456789012<br />
You are a market<strong>in</strong>g manager <strong>for</strong> a small<br />
manufactur<strong>in</strong>g firm. This graph shows your<br />
company’s sales over the last three years. Given the<br />
seasonal pattern shown on the graph, predict the<br />
sales <strong>for</strong> Spr<strong>in</strong>g 1985 (<strong>in</strong> thousands) by putt<strong>in</strong>g an “x”<br />
on the graph.<br />
Spr<strong>in</strong>g –<br />
1982 1983 1984 1985<br />
Summer –<br />
Fall –<br />
[<strong>in</strong>sert l<strong>in</strong>e graph ART here]<br />
W<strong>in</strong>ter –<br />
Spr<strong>in</strong>g –<br />
Summer –<br />
Fall –<br />
W<strong>in</strong>ter –<br />
1234567890123456789012<br />
1234567890123456789012<br />
1234567890123456789012<br />
Spr<strong>in</strong>g –<br />
Summer –<br />
Fall –<br />
W<strong>in</strong>ter –<br />
Spr<strong>in</strong>g –<br />
Reduced from orig<strong>in</strong>al copy.
