

Adult Literacy in America - National Center for Education Statistics ...
Adult Literacy in America - National Center for Education Statistics ...
Adult Literacy in America - National Center for Education Statistics ...

You also want an ePaper? Increase the reach of your titles
YUMPU automatically turns print PDFs into web optimized ePapers that Google loves.
Percentage <strong>in</strong> Level<br />
Percentage <strong>in</strong> Level<br />
Percentage <strong>in</strong> Level<br />
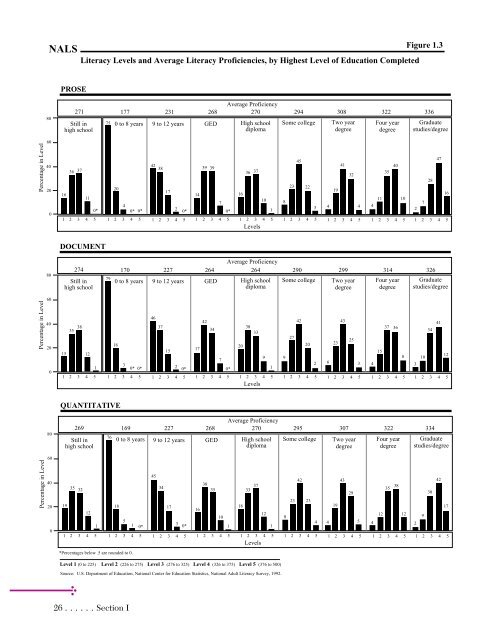
NALS<br />
80<br />
60<br />
40<br />
20<br />
0<br />
80<br />
60<br />
40<br />
20<br />
0<br />
80<br />
60<br />
40<br />
20<br />
0<br />
PROSE<br />
Still <strong>in</strong><br />
high school<br />
16<br />
36 37<br />
<strong>Literacy</strong> Levels and Average <strong>Literacy</strong> Proficiencies, by Highest Level of <strong>Education</strong> Completed<br />
11<br />
0*<br />
75<br />
20<br />
26 ......Section I<br />
4<br />
0* 0*<br />
Figure 1.3<br />
Average Proficiency<br />
177 231 268 270 294 308 322 336<br />
0 to 8 years<br />
9 to 12 years<br />
42<br />
38<br />
17<br />
2<br />
0*<br />
14<br />
GED<br />
39 39<br />
7<br />
0*<br />
16<br />
High school<br />
diploma<br />
36 37<br />
Some college<br />
Two year<br />
degree<br />
Four year<br />
degree<br />
Graduate<br />
studies/degree<br />
1 2 3 4 5 1 2 3 4 5 1 2 3 4 5 1 2 3 4 5 1 2 3 4 5<br />
Levels<br />
1 2 3 4 5 1 2 3 4 5 1 2 3 4 5 1 2 3 4 5<br />
DOCUMENT<br />
Still <strong>in</strong><br />
high school<br />
15<br />
35 38<br />
12<br />
1<br />
79<br />
10<br />
1<br />
Average Proficiency<br />
170 227 264 264 290 299 314 326<br />
0 to 8 years<br />
18<br />
3<br />
0* 0*<br />
9 to 12 years<br />
46<br />
37<br />
15<br />
2<br />
0*<br />
17<br />
GED<br />
42<br />
34<br />
7<br />
0*<br />
20<br />
High school<br />
diploma<br />
38<br />
33<br />
8<br />
23<br />
45<br />
22<br />
Some college<br />
3<br />
4<br />
19<br />
41<br />
32<br />
Two year<br />
degree<br />
4<br />
4<br />
11<br />
35<br />
40<br />
Four year<br />
degree<br />
10<br />
2<br />
7<br />
28<br />
47<br />
16<br />
Graduate<br />
studies/degree<br />
1 2 3 4 5 1 2 3 4 5 1 2 3 4 5 1 2 3 4 5 1 2 3 4 5<br />
Levels<br />
1 2 3 4 5 1 2 3 4 5 1 2 3 4 5 1 2 3 4 5<br />
QUANTITATIVE<br />
Still <strong>in</strong><br />
high school<br />
19<br />
271<br />
274<br />
269<br />
35 32<br />
12<br />
1<br />
76<br />
9<br />
1<br />
Average Proficiency<br />
169 227 268 270 295 307 322 334<br />
0 to 8 years<br />
18<br />
9 to 12 years<br />
16<br />
GED<br />
38<br />
35<br />
10<br />
1<br />
18<br />
High school<br />
diploma<br />
33 37<br />
9<br />
27<br />
42<br />
20<br />
2<br />
Some college<br />
6<br />
23<br />
43<br />
25<br />
Two year<br />
degree<br />
3 4<br />
15<br />
37 36<br />
Four year<br />
degree<br />
8<br />
3<br />
10<br />
34<br />
41<br />
12<br />
Graduate<br />
studies/degree<br />
1 2 3 4 5 1 2 3 4 5 1 2 3 4 5 1 2 3 4 5 1 2 3 4 5<br />
Levels<br />
1 2 3 4 5 1 2 3 4 5 1 2 3 4 5 1 2 3 4 5<br />
*Percentages below .5 are rounded to 0.<br />
5<br />
1<br />
0*<br />
45<br />
34<br />
17<br />
Level 1 (0 to 225) Level 2 (226 to 275) Level 3 (276 to 325) Level 4 (326 to 375) Level 5 (376 to 500)<br />
Source: U.S. Department of <strong>Education</strong>, <strong>National</strong> <strong>Center</strong> <strong>for</strong> <strong>Education</strong> <strong>Statistics</strong>, <strong>National</strong> <strong>Adult</strong> <strong>Literacy</strong> Survey, 1992.<br />
3 0*<br />
12<br />
1<br />
8<br />
23<br />
42<br />
23<br />
4 4<br />
19<br />
43<br />
29<br />
5 4<br />
12<br />
35 38<br />
12<br />
2<br />
9<br />
30<br />
42<br />
17
