

Adult Literacy in America - National Center for Education Statistics ...
Adult Literacy in America - National Center for Education Statistics ...
Adult Literacy in America - National Center for Education Statistics ...

You also want an ePaper? Increase the reach of your titles
YUMPU automatically turns print PDFs into web optimized ePapers that Google loves.
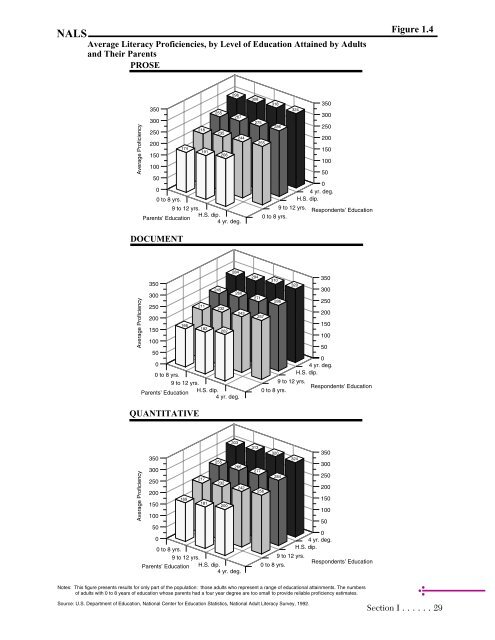
NALS<br />
Average <strong>Literacy</strong> Proficiencies, by Level of <strong>Education</strong> Atta<strong>in</strong>ed by <strong>Adult</strong>s<br />
and Their Parents<br />
PROSE<br />
Average Proficiency<br />
350<br />
300<br />
250<br />
200<br />
150<br />
100<br />
50<br />
0<br />
350<br />
300<br />
250<br />
200<br />
150<br />
100<br />
50<br />
0<br />
350<br />
300<br />
250<br />
200<br />
150<br />
100<br />
50<br />
0<br />
0 to 8 yrs.<br />
DOCUMENT<br />
Average Proficiency<br />
Average Proficiency<br />
0-8 years<br />
0-8 years<br />
174<br />
218<br />
9 to 12 yrs.<br />
9-12 years<br />
9-12 years<br />
191<br />
255<br />
235<br />
H.S. dip.<br />
HS dip<br />
HS dip<br />
208<br />
296<br />
267<br />
0 to 8 yrs.<br />
9 to 12 yrs.<br />
H.S. dip.<br />
Parents’ <strong>Education</strong><br />
4 yr. deg.<br />
166<br />
169<br />
211<br />
182<br />
217<br />
181<br />
245<br />
232<br />
255<br />
202<br />
232<br />
200<br />
4 yr. deg.<br />
284<br />
4 year deg<br />
303<br />
4 year deg<br />
244<br />
260<br />
0 to 8 yrs.<br />
9 to 12 yrs.<br />
Parents’ <strong>Education</strong><br />
H.S. dip.<br />
4 yr. deg.<br />
QUANTITATIVE<br />
266<br />
0 to 8 yrs.<br />
9 to 12 yrs.<br />
Parents’ <strong>Education</strong> H.S. dip.<br />
4 yr. deg.<br />
243<br />
242<br />
308<br />
275<br />
294<br />
271<br />
313<br />
277<br />
255<br />
318<br />
286<br />
324<br />
350<br />
300<br />
250<br />
200<br />
150<br />
100<br />
50<br />
0<br />
4 4 yr. yr. deg. deg.<br />
H.S. dip.<br />
9 to to 12 yrs.<br />
Respondents’ <strong>Education</strong><br />
0 to 8 yrs.<br />
257<br />
350<br />
300<br />
250<br />
200<br />
150<br />
100<br />
50<br />
0<br />
4 4 yr. year deg. deg.<br />
HS H.S. dip dip.<br />
9 9-12 to 12 years yrs.<br />
Respondents’ <strong>Education</strong><br />
0 0-8 to years 8 yrs.<br />
256<br />
310<br />
286<br />
320<br />
284<br />
320<br />
324<br />
350<br />
300<br />
250<br />
200<br />
150<br />
100<br />
50<br />
0<br />
4 4 yr. year deg. deg.<br />
H.S. HS dip dip.<br />
9 9-12 to 12 years yrs.<br />
0-8 years<br />
Respondents’ <strong>Education</strong><br />
0 to 8 yrs.<br />
Notes: This figure presents results <strong>for</strong> only part of the population: those adults who represent a range of educational atta<strong>in</strong>ments. The numbers<br />
of adults with 0 to 8 years of education whose parents had a four year degree are too small to provide reliable proficiency estimates.<br />
Source: U.S. Department of <strong>Education</strong>, <strong>National</strong> <strong>Center</strong> <strong>for</strong> <strong>Education</strong> <strong>Statistics</strong>, <strong>National</strong> <strong>Adult</strong> <strong>Literacy</strong> Survey, 1992.<br />
Figure 1.4<br />
Section I ......29
