

Adult Literacy in America - National Center for Education Statistics ...
Adult Literacy in America - National Center for Education Statistics ...
Adult Literacy in America - National Center for Education Statistics ...

You also want an ePaper? Increase the reach of your titles
YUMPU automatically turns print PDFs into web optimized ePapers that Google loves.
NALS<br />
128 ......Appendix A<br />
common items. Fifty-one percent of the items adm<strong>in</strong>istered <strong>in</strong> the national<br />
survey were common to young adult survey. The composition of the item pool<br />
is presented <strong>in</strong> table A.1.<br />
A unidimensional IRT model like the three-parameter logistic model<br />
employed <strong>in</strong> this study assumes that per<strong>for</strong>mance on all the items <strong>in</strong> a doma<strong>in</strong><br />
can, <strong>for</strong> the most part, be accounted <strong>for</strong> by a s<strong>in</strong>gle (unobservable) proficiency<br />
variable. Subsequent IRT l<strong>in</strong>k<strong>in</strong>g and scal<strong>in</strong>g analyses treat each scale<br />
separately, that is, a unique proficiency is assumed <strong>for</strong> each scale. As a result,<br />
the l<strong>in</strong>k<strong>in</strong>g of correspond<strong>in</strong>g scales was carried out <strong>for</strong> each pair of scales<br />
separately. The three steps used to l<strong>in</strong>k the scales are listed below.<br />
1. Establish provisional IRT scales through common item parameter<br />
calibration based on a pool<strong>in</strong>g of the NALS and YALS items.<br />
2. Estimate distribution of proficiencies on the provisional IRT scales us<strong>in</strong>g<br />
“ plausible value” methodology.<br />
3. Align the NALS scale to the YALS scale by a l<strong>in</strong>ear trans<strong>for</strong>mation based<br />
upon the commonality of proficiency distribution of the YALS sample.<br />
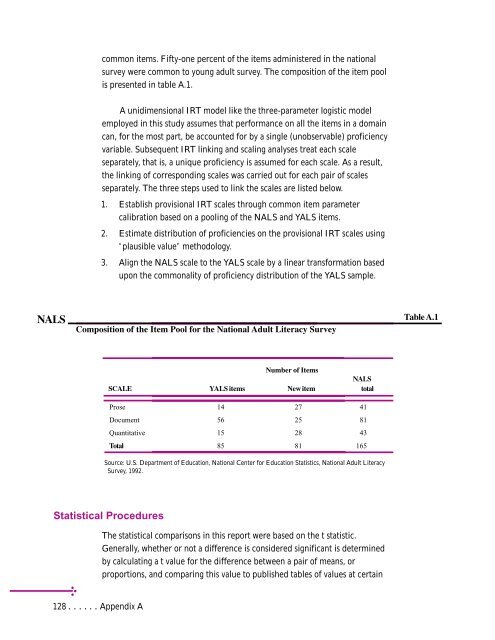
Composition of the Item Pool <strong>for</strong> the <strong>National</strong> <strong>Adult</strong> <strong>Literacy</strong> Survey<br />
Number of Items<br />
SCALE YALS items New item<br />
NALS<br />
total<br />
Prose 14 27 41<br />
Document 56 25 81<br />
Quantitative 15 28 43<br />
Total 85 81 165<br />
Source: U.S. Department of <strong>Education</strong>, <strong>National</strong> <strong>Center</strong> <strong>for</strong> <strong>Education</strong> <strong>Statistics</strong>, <strong>National</strong> <strong>Adult</strong> <strong>Literacy</strong><br />
Survey, 1992.<br />
Statistical Procedures<br />
The statistical comparisons <strong>in</strong> this report were based on the t statistic.<br />
Generally, whether or not a difference is considered significant is determ<strong>in</strong>ed<br />
by calculat<strong>in</strong>g a t value <strong>for</strong> the difference between a pair of means, or<br />
proportions, and compar<strong>in</strong>g this value to published tables of values at certa<strong>in</strong><br />
Table A.1
