

Adult Literacy in America - National Center for Education Statistics ...
Adult Literacy in America - National Center for Education Statistics ...
Adult Literacy in America - National Center for Education Statistics ...

You also want an ePaper? Increase the reach of your titles
YUMPU automatically turns print PDFs into web optimized ePapers that Google loves.
NALS<br />
Level<br />
1<br />
2<br />
3<br />
4<br />
5<br />
1<br />
2<br />
3<br />
4<br />
5<br />
1<br />
2<br />
3<br />
4<br />
5<br />
1<br />
2<br />
3<br />
4<br />
5<br />
5<br />
7<br />
2<br />
8<br />
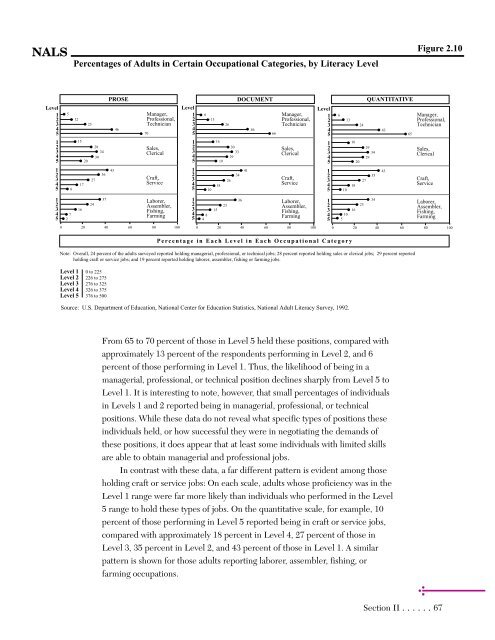
Percentages of <strong>Adult</strong>s <strong>in</strong> Certa<strong>in</strong> Occupational Categories, by <strong>Literacy</strong> Level<br />
12<br />
15<br />
17<br />
16<br />
20<br />
23<br />
27<br />
24<br />
28<br />
34<br />
30<br />
36<br />
37<br />
PROSE<br />
43<br />
46<br />
Manager,<br />
Professional,<br />
Technician<br />
70<br />
Sales,<br />
Clerical<br />
Craft,<br />
Service<br />
Laborer,<br />
Assembler,<br />
Fish<strong>in</strong>g,<br />
Farm<strong>in</strong>g<br />
Level<br />
1<br />
2<br />
3<br />
4<br />
5<br />
1<br />
2<br />
3<br />
4<br />
5<br />
1<br />
2<br />
3<br />
4<br />
5<br />
1<br />
2<br />
3<br />
4<br />
5<br />
6<br />
8<br />
4<br />
10<br />
13<br />
15<br />
16<br />
18<br />
19<br />
23<br />
26<br />
30<br />
33<br />
29<br />
26<br />
DOCUMENT<br />
34<br />
36<br />
41<br />
From 65 to 70 percent of those <strong>in</strong> Level 5 held these positions, compared with<br />
approximately 13 percent of the respondents per<strong>for</strong>m<strong>in</strong>g <strong>in</strong> Level 2, and 6<br />
percent of those per<strong>for</strong>m<strong>in</strong>g <strong>in</strong> Level 1. Thus, the likelihood of be<strong>in</strong>g <strong>in</strong> a<br />
managerial, professional, or technical position decl<strong>in</strong>es sharply from Level 5 to<br />
Level 1. It is <strong>in</strong>terest<strong>in</strong>g to note, however, that small percentages of <strong>in</strong>dividuals<br />
<strong>in</strong> Levels 1 and 2 reported be<strong>in</strong>g <strong>in</strong> managerial, professional, or technical<br />
positions. While these data do not reveal what specific types of positions these<br />
<strong>in</strong>dividuals held, or how successful they were <strong>in</strong> negotiat<strong>in</strong>g the demands of<br />
these positions, it does appear that at least some <strong>in</strong>dividuals with limited skills<br />
are able to obta<strong>in</strong> managerial and professional jobs.<br />
In contrast with these data, a far different pattern is evident among those<br />
hold<strong>in</strong>g craft or service jobs: On each scale, adults whose proficiency was <strong>in</strong> the<br />
Level 1 range were far more likely than <strong>in</strong>dividuals who per<strong>for</strong>med <strong>in</strong> the Level<br />
5 range to hold these types of jobs. On the quantitative scale, <strong>for</strong> example, 10<br />
percent of those per<strong>for</strong>m<strong>in</strong>g <strong>in</strong> Level 5 reported be<strong>in</strong>g <strong>in</strong> craft or service jobs,<br />
compared with approximately 18 percent <strong>in</strong> Level 4, 27 percent of those <strong>in</strong><br />
Level 3, 35 percent <strong>in</strong> Level 2, and 43 percent of those <strong>in</strong> Level 1. A similar<br />
pattern is shown <strong>for</strong> those adults report<strong>in</strong>g laborer, assembler, fish<strong>in</strong>g, or<br />
farm<strong>in</strong>g occupations.<br />
46<br />
Figure 2.10<br />
0 20 40 60 80 100 0 20 40 60 80 100 0 20 40 60 80 100<br />
66<br />
Manager,<br />
Professional,<br />
Technician<br />
Sales,<br />
Clerical<br />
Craft,<br />
Service<br />
Laborer,<br />
Assembler,<br />
Fish<strong>in</strong>g,<br />
Farm<strong>in</strong>g<br />
Level<br />
1<br />
2<br />
3<br />
4<br />
5<br />
6<br />
10<br />
10<br />
5<br />
13<br />
16<br />
18<br />
16<br />
20<br />
24<br />
23<br />
27<br />
QUANTITATIVE<br />
Note: Overall, 24 percent of the adults surveyed reported hold<strong>in</strong>g managerial, professional, or technical jobs; 28 percent reported hold<strong>in</strong>g sales or clerical jobs; 29 percent reported<br />
hold<strong>in</strong>g craft or service jobs; and 19 percent reported hold<strong>in</strong>g laborer, assembler, fish<strong>in</strong>g or farm<strong>in</strong>g jobs.<br />
Level 1 0 to 225<br />
Level 2 226 to 275<br />
Level 3 276 to 325<br />
Level 4 326 to 375<br />
Level 5 376 to 500<br />
Percentage <strong>in</strong> Each Level <strong>in</strong> Each Occupational Category<br />
Source: U.S. Department of <strong>Education</strong>, <strong>National</strong> <strong>Center</strong> <strong>for</strong> <strong>Education</strong> <strong>Statistics</strong>, <strong>National</strong> <strong>Adult</strong> <strong>Literacy</strong> Survey, 1992.<br />
1<br />
2<br />
3<br />
4<br />
5<br />
1<br />
2<br />
3<br />
4<br />
5<br />
1<br />
2<br />
3<br />
4<br />
5<br />
29<br />
34<br />
29<br />
35<br />
34<br />
43<br />
43<br />
Section II ......67<br />
65<br />
Manager,<br />
Professional,<br />
Technician<br />
Sales,<br />
Clerical<br />
Craft,<br />
Service<br />
Laborer,<br />
Assembler,<br />
Fish<strong>in</strong>g,<br />
Farm<strong>in</strong>g
