

Adult Literacy in America - National Center for Education Statistics ...
Adult Literacy in America - National Center for Education Statistics ...
Adult Literacy in America - National Center for Education Statistics ...

Create successful ePaper yourself
Turn your PDF publications into a flip-book with our unique Google optimized e-Paper software.
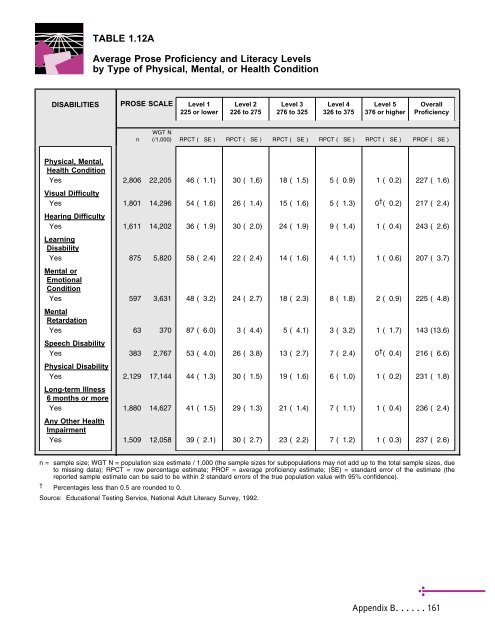
Physical, Mental,<br />
Health Condition<br />
Yes<br />
Visual Difficulty<br />
Yes<br />
Hear<strong>in</strong>g Difficulty<br />
Yes<br />
Learn<strong>in</strong>g<br />
Disability<br />
Yes<br />
Mental or<br />
Emotional<br />
Condition<br />
Yes<br />
Mental<br />
Retardation<br />
Yes<br />
Speech Disability<br />
Yes<br />
Physical Disability<br />
Yes<br />
Long-term Illness<br />
6 months or more<br />
Yes<br />
Any Other Health<br />
Impairment<br />
Yes<br />
TABLE 1.12A<br />
Average Prose Proficiency and <strong>Literacy</strong> Levels<br />
by Type of Physical, Mental, or Health Condition<br />
DISABILITIES PROSE SCALE Level 1<br />
225 or lower<br />
WGT N<br />
n (/1,000)<br />
RPCT ( SE )<br />
Level 2<br />
226 to 275<br />
RPCT ( SE )<br />
Level 3<br />
276 to 325<br />
RPCT ( SE )<br />
Level 4<br />
326 to 375<br />
RPCT ( SE )<br />
Level 5<br />
376 or higher<br />
RPCT ( SE )<br />
Overall<br />
Proficiency<br />
PROF ( SE )<br />
2,806 22,205 46 ( 1.1) 30 ( 1.6) 18 ( 1.5) 5 ( 0.9) 1 ( 0.2) 227 ( 1.6)<br />
1,801 14,296 54 ( 1.6) 26 ( 1.4) 15 ( 1.6) 5 ( 1.3) 0 † ( 0.2) 217 ( 2.4)<br />
1,611 14,202 36 ( 1.9) 30 ( 2.0) 24 ( 1.9) 9 ( 1.4) 1 ( 0.4) 243 ( 2.6)<br />
875 5,820 58 ( 2.4) 22 ( 2.4) 14 ( 1.6) 4 ( 1.1) 1 ( 0.6) 207 ( 3.7)<br />
597 3,631 48 ( 3.2) 24 ( 2.7) 18 ( 2.3) 8 ( 1.8) 2 ( 0.9) 225 ( 4.8)<br />
63 370 87 ( 6.0) 3 ( 4.4) 5 ( 4.1) 3 ( 3.2) 1 ( 1.7) 143 (13.6)<br />
383 2,767 53 ( 4.0) 26 ( 3.8) 13 ( 2.7) 7 ( 2.4) 0 † ( 0.4) 216 ( 6.6)<br />
2,129 17,144 44 ( 1.3) 30 ( 1.5) 19 ( 1.6) 6 ( 1.0) 1 ( 0.2) 231 ( 1.8)<br />
1,880 14,627 41 ( 1.5) 29 ( 1.3) 21 ( 1.4) 7 ( 1.1) 1 ( 0.4) 236 ( 2.4)<br />
1,509 12,058 39 ( 2.1) 30 ( 2.7) 23 ( 2.2) 7 ( 1.2) 1 ( 0.3) 237 ( 2.6)<br />
n = sample size; WGT N = population size estimate / 1,000 (the sample sizes <strong>for</strong> subpopulations may not add up to the total sample sizes, due<br />
to miss<strong>in</strong>g data); RPCT = row percentage estimate; PROF = average proficiency estimate; (SE) = standard error of the estimate (the<br />
reported sample estimate can be said to be with<strong>in</strong> 2 standard errors of the true population value with 95% confidence).<br />
† Percentages less than 0.5 are rounded to 0.<br />
Source: <strong>Education</strong>al Test<strong>in</strong>g Service, <strong>National</strong> <strong>Adult</strong> <strong>Literacy</strong> Survey, 1992.<br />
Appendix B......161
