

Adult Literacy in America - National Center for Education Statistics ...
Adult Literacy in America - National Center for Education Statistics ...
Adult Literacy in America - National Center for Education Statistics ...

Create successful ePaper yourself
Turn your PDF publications into a flip-book with our unique Google optimized e-Paper software.
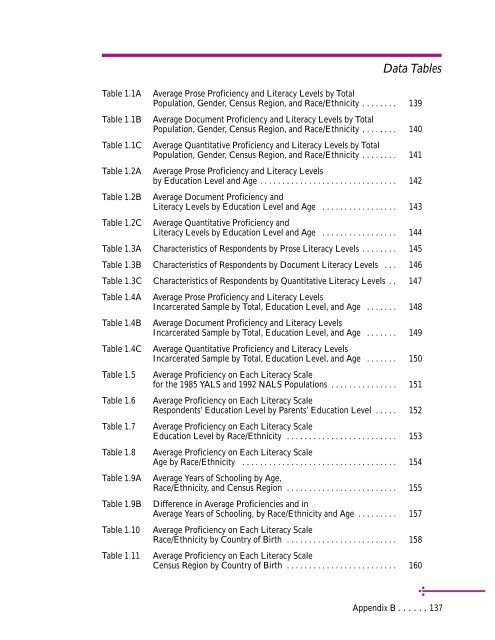
Data Tables<br />
Table 1.1A Average Prose Proficiency and <strong>Literacy</strong> Levels by Total<br />
Population, Gender, Census Region, and Race/Ethnicity . . . . . . . . 139<br />
Table 1.1B Average Document Proficiency and <strong>Literacy</strong> Levels by Total<br />
Population, Gender, Census Region, and Race/Ethnicity . . . . . . . . 140<br />
Table 1.1C Average Quantitative Proficiency and <strong>Literacy</strong> Levels by Total<br />
Population, Gender, Census Region, and Race/Ethnicity . . . . . . . . 141<br />
Table 1.2A Average Prose Proficiency and <strong>Literacy</strong> Levels<br />
by <strong>Education</strong> Level and Age . . . . . . . . . . . . . . . . . . . . . . . . . . . . . . . 142<br />
Table 1.2B Average Document Proficiency and<br />
<strong>Literacy</strong> Levels by <strong>Education</strong> Level and Age . . . . . . . . . . . . . . . . . 143<br />
Table 1.2C Average Quantitative Proficiency and<br />
<strong>Literacy</strong> Levels by <strong>Education</strong> Level and Age . . . . . . . . . . . . . . . . . 144<br />
Table 1.3A Characteristics of Respondents by Prose <strong>Literacy</strong> Levels . . . . . . . . 145<br />
Table 1.3B Characteristics of Respondents by Document <strong>Literacy</strong> Levels . . . 146<br />
Table 1.3C Characteristics of Respondents by Quantitative <strong>Literacy</strong> Levels . . 147<br />
Table 1.4A Average Prose Proficiency and <strong>Literacy</strong> Levels<br />
Incarcerated Sample by Total, <strong>Education</strong> Level, and Age . . . . . . . 148<br />
Table 1.4B Average Document Proficiency and <strong>Literacy</strong> Levels<br />
Incarcerated Sample by Total, <strong>Education</strong> Level, and Age . . . . . . . 149<br />
Table 1.4C Average Quantitative Proficiency and <strong>Literacy</strong> Levels<br />
Incarcerated Sample by Total, <strong>Education</strong> Level, and Age . . . . . . . 150<br />
Table 1.5 Average Proficiency on Each <strong>Literacy</strong> Scale<br />
<strong>for</strong> the 1985 YALS and 1992 NALS Populations . . . . . . . . . . . . . . . 151<br />
Table 1.6 Average Proficiency on Each <strong>Literacy</strong> Scale<br />
Respondents’ <strong>Education</strong> Level by Parents’ <strong>Education</strong> Level . . . . . 152<br />
Table 1.7 Average Proficiency on Each <strong>Literacy</strong> Scale<br />
<strong>Education</strong> Level by Race/Ethnicity . . . . . . . . . . . . . . . . . . . . . . . . . 153<br />
Table 1.8 Average Proficiency on Each <strong>Literacy</strong> Scale<br />
Age by Race/Ethnicity . . . . . . . . . . . . . . . . . . . . . . . . . . . . . . . . . . . 154<br />
Table 1.9A Average Years of School<strong>in</strong>g by Age,<br />
Race/Ethnicity, and Census Region . . . . . . . . . . . . . . . . . . . . . . . . . 155<br />
Table 1.9B Difference <strong>in</strong> Average Proficiencies and <strong>in</strong><br />
Average Years of School<strong>in</strong>g, by Race/Ethnicity and Age . . . . . . . . . 157<br />
Table 1.10 Average Proficiency on Each <strong>Literacy</strong> Scale<br />
Race/Ethnicity by Country of Birth . . . . . . . . . . . . . . . . . . . . . . . . . 158<br />
Table 1.11 Average Proficiency on Each <strong>Literacy</strong> Scale<br />
Census Region by Country of Birth . . . . . . . . . . . . . . . . . . . . . . . . . 160<br />
Appendix B ......137
