

Adult Literacy in America - National Center for Education Statistics ...
Adult Literacy in America - National Center for Education Statistics ...
Adult Literacy in America - National Center for Education Statistics ...

Create successful ePaper yourself
Turn your PDF publications into a flip-book with our unique Google optimized e-Paper software.
NALS<br />
Average Number of Weeks Worked <strong>in</strong> the Past 12 Months, by <strong>Literacy</strong> Level<br />
PROSE<br />
Level Level<br />
1<br />
19 19<br />
1<br />
2<br />
27 27<br />
2<br />
3<br />
35<br />
35<br />
3<br />
4<br />
38<br />
38<br />
4<br />
5<br />
44<br />
44 5<br />
Level 1 0 to 225<br />
Level 2 226 to 275<br />
Level 3 276 to 325<br />
Level 4 326 to 375<br />
Level 5 376 to 500<br />
19<br />
DOCUMENT<br />
19<br />
29<br />
35<br />
Source: U.S. Department of <strong>Education</strong>, <strong>National</strong> <strong>Center</strong> <strong>for</strong> <strong>Education</strong> <strong>Statistics</strong>, <strong>National</strong> <strong>Adult</strong> <strong>Literacy</strong> Survey, 1992.<br />
40<br />
43<br />
Average Number of Weeks Worked by <strong>Adult</strong>s <strong>in</strong> Each Level<br />
QUANTITATIVE<br />
Figure 2.8<br />
0 20 13 40 26 60 3980 100 52 0 20 13 40 26 60 3980 100 52 0 20 13 40 26 60 3980 100 52<br />
Earn<strong>in</strong>gs<br />
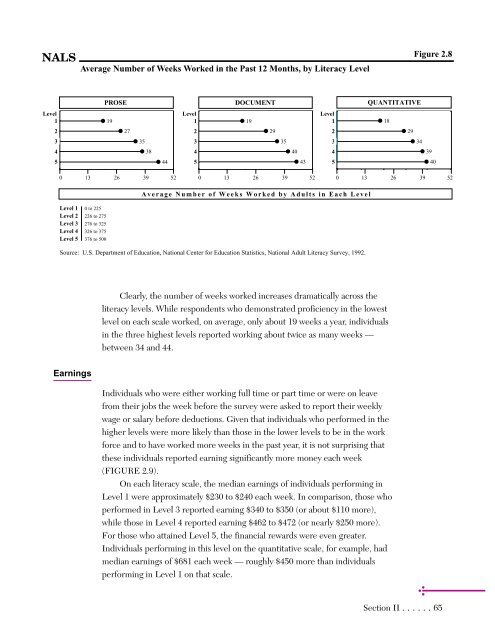
Clearly, the number of weeks worked <strong>in</strong>creases dramatically across the<br />
literacy levels. While respondents who demonstrated proficiency <strong>in</strong> the lowest<br />
level on each scale worked, on average, only about 19 weeks a year, <strong>in</strong>dividuals<br />
<strong>in</strong> the three highest levels reported work<strong>in</strong>g about twice as many weeks —<br />
between 34 and 44.<br />
Individuals who were either work<strong>in</strong>g full time or part time or were on leave<br />
from their jobs the week be<strong>for</strong>e the survey were asked to report their weekly<br />
wage or salary be<strong>for</strong>e deductions. Given that <strong>in</strong>dividuals who per<strong>for</strong>med <strong>in</strong> the<br />
higher levels were more likely than those <strong>in</strong> the lower levels to be <strong>in</strong> the work<br />
<strong>for</strong>ce and to have worked more weeks <strong>in</strong> the past year, it is not surpris<strong>in</strong>g that<br />
these <strong>in</strong>dividuals reported earn<strong>in</strong>g significantly more money each week<br />
(FIGURE 2.9).<br />
On each literacy scale, the median earn<strong>in</strong>gs of <strong>in</strong>dividuals per<strong>for</strong>m<strong>in</strong>g <strong>in</strong><br />
Level 1 were approximately $230 to $240 each week. In comparison, those who<br />
per<strong>for</strong>med <strong>in</strong> Level 3 reported earn<strong>in</strong>g $340 to $350 (or about $110 more),<br />
while those <strong>in</strong> Level 4 reported earn<strong>in</strong>g $462 to $472 (or nearly $250 more).<br />
For those who atta<strong>in</strong>ed Level 5, the f<strong>in</strong>ancial rewards were even greater.<br />
Individuals per<strong>for</strong>m<strong>in</strong>g <strong>in</strong> this level on the quantitative scale, <strong>for</strong> example, had<br />
median earn<strong>in</strong>gs of $681 each week — roughly $450 more than <strong>in</strong>dividuals<br />
per<strong>for</strong>m<strong>in</strong>g <strong>in</strong> Level 1 on that scale.<br />
29<br />
Level<br />
1<br />
18 18<br />
2<br />
29 29<br />
35 3<br />
34<br />
34<br />
40<br />
4<br />
39<br />
39<br />
43 5<br />
40<br />
40<br />
Section II ......65
