

Adult Literacy in America - National Center for Education Statistics ...
Adult Literacy in America - National Center for Education Statistics ...
Adult Literacy in America - National Center for Education Statistics ...

You also want an ePaper? Increase the reach of your titles
YUMPU automatically turns print PDFs into web optimized ePapers that Google loves.
NALS<br />
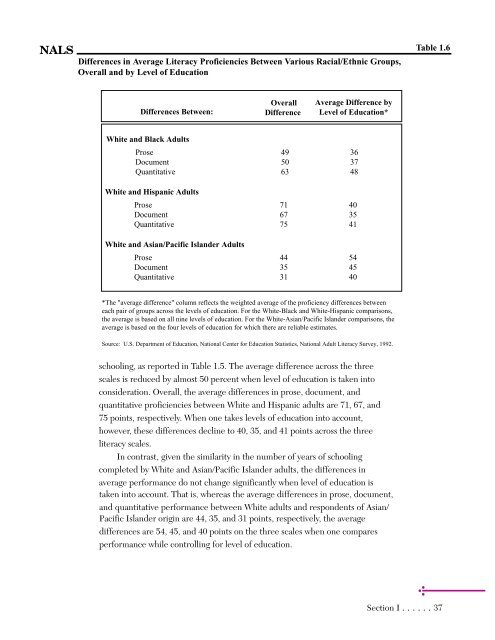
Differences <strong>in</strong> Average <strong>Literacy</strong> Proficiencies Between Various Racial/Ethnic Groups,<br />
Overall and by Level of <strong>Education</strong><br />
Differences Between:<br />
Overall<br />
Difference<br />
Average Difference by<br />
Level of <strong>Education</strong>*<br />
White and Black <strong>Adult</strong>s<br />
Prose 49 36<br />
Document 50 37<br />
Quantitative 63 48<br />
White and Hispanic <strong>Adult</strong>s<br />
Prose 71 40<br />
Document 67 35<br />
Quantitative 75 41<br />
White and Asian/Pacific Islander <strong>Adult</strong>s<br />
Prose 44 54<br />
Document 35 45<br />
Quantitative 31 40<br />
*The "average difference" column reflects the weighted average of the proficiency differences between<br />
each pair of groups across the levels of education. For the White-Black and White-Hispanic comparisons,<br />
the average is based on all n<strong>in</strong>e levels of education. For the White-Asian/Pacific Islander comparisons, the<br />
average is based on the four levels of education <strong>for</strong> which there are reliable estimates.<br />
Source: U.S. Department of <strong>Education</strong>, <strong>National</strong> <strong>Center</strong> <strong>for</strong> <strong>Education</strong> <strong>Statistics</strong>, <strong>National</strong> <strong>Adult</strong> <strong>Literacy</strong> Survey, 1992.<br />
school<strong>in</strong>g, as reported <strong>in</strong> Table 1.5. The average difference across the three<br />
scales is reduced by almost 50 percent when level of education is taken <strong>in</strong>to<br />
consideration. Overall, the average differences <strong>in</strong> prose, document, and<br />
quantitative proficiencies between White and Hispanic adults are 71, 67, and<br />
75 po<strong>in</strong>ts, respectively. When one takes levels of education <strong>in</strong>to account,<br />
however, these differences decl<strong>in</strong>e to 40, 35, and 41 po<strong>in</strong>ts across the three<br />
literacy scales.<br />
In contrast, given the similarity <strong>in</strong> the number of years of school<strong>in</strong>g<br />
completed by White and Asian/Pacific Islander adults, the differences <strong>in</strong><br />
average per<strong>for</strong>mance do not change significantly when level of education is<br />
taken <strong>in</strong>to account. That is, whereas the average differences <strong>in</strong> prose, document,<br />
and quantitative per<strong>for</strong>mance between White adults and respondents of Asian/<br />
Pacific Islander orig<strong>in</strong> are 44, 35, and 31 po<strong>in</strong>ts, respectively, the average<br />
differences are 54, 45, and 40 po<strong>in</strong>ts on the three scales when one compares<br />
per<strong>for</strong>mance while controll<strong>in</strong>g <strong>for</strong> level of education.<br />
Table 1.6<br />
Section I ......37
