

Adult Literacy in America - National Center for Education Statistics ...
Adult Literacy in America - National Center for Education Statistics ...
Adult Literacy in America - National Center for Education Statistics ...

You also want an ePaper? Increase the reach of your titles
YUMPU automatically turns print PDFs into web optimized ePapers that Google loves.
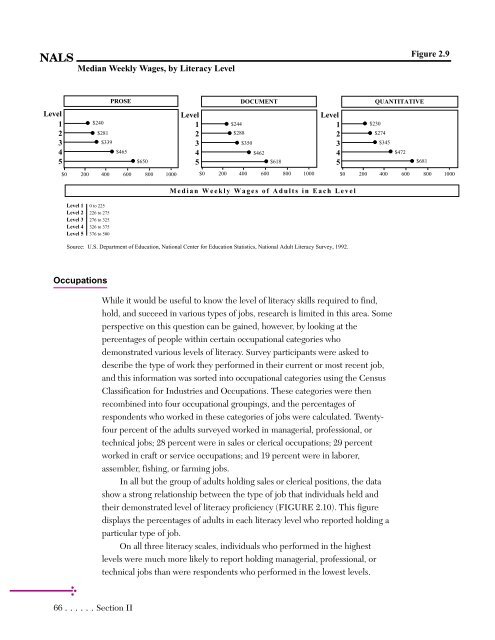
NALS<br />
Median Weekly Wages, by <strong>Literacy</strong> Level<br />
$240<br />
$281<br />
$339<br />
Occupations<br />
PROSE<br />
$465<br />
66 ......Section II<br />
$650<br />
DOCUMENT<br />
Level Level Level<br />
1<br />
2<br />
3<br />
4<br />
5<br />
$244<br />
$288<br />
$350<br />
$462<br />
While it would be useful to know the level of literacy skills required to f<strong>in</strong>d,<br />
hold, and succeed <strong>in</strong> various types of jobs, research is limited <strong>in</strong> this area. Some<br />
perspective on this question can be ga<strong>in</strong>ed, however, by look<strong>in</strong>g at the<br />
percentages of people with<strong>in</strong> certa<strong>in</strong> occupational categories who<br />
demonstrated various levels of literacy. Survey participants were asked to<br />
describe the type of work they per<strong>for</strong>med <strong>in</strong> their current or most recent job,<br />
and this <strong>in</strong><strong>for</strong>mation was sorted <strong>in</strong>to occupational categories us<strong>in</strong>g the Census<br />
Classification <strong>for</strong> Industries and Occupations. These categories were then<br />
recomb<strong>in</strong>ed <strong>in</strong>to four occupational group<strong>in</strong>gs, and the percentages of<br />
respondents who worked <strong>in</strong> these categories of jobs were calculated. Twentyfour<br />
percent of the adults surveyed worked <strong>in</strong> managerial, professional, or<br />
technical jobs; 28 percent were <strong>in</strong> sales or clerical occupations; 29 percent<br />
worked <strong>in</strong> craft or service occupations; and 19 percent were <strong>in</strong> laborer,<br />
assembler, fish<strong>in</strong>g, or farm<strong>in</strong>g jobs.<br />
In all but the group of adults hold<strong>in</strong>g sales or clerical positions, the data<br />
show a strong relationship between the type of job that <strong>in</strong>dividuals held and<br />
their demonstrated level of literacy proficiency (FIGURE 2.10). This figure<br />
displays the percentages of adults <strong>in</strong> each literacy level who reported hold<strong>in</strong>g a<br />
particular type of job.<br />
On all three literacy scales, <strong>in</strong>dividuals who per<strong>for</strong>med <strong>in</strong> the highest<br />
levels were much more likely to report hold<strong>in</strong>g managerial, professional, or<br />
technical jobs than were respondents who per<strong>for</strong>med <strong>in</strong> the lowest levels.<br />
Figure 2.9<br />
$0 200 400 600 800 1000 $0 200 400 600 800 1000 $0 200 400 600 800 1000<br />
Level 1 0 to 225<br />
Level 2 226 to 275<br />
Level 3 276 to 325<br />
Level 4 326 to 375<br />
Level 5 376 to 500<br />
1<br />
2<br />
3<br />
4<br />
5<br />
$618<br />
Median Weekly Wages of <strong>Adult</strong>s <strong>in</strong> Each Level<br />
Source: U.S. Department of <strong>Education</strong>, <strong>National</strong> <strong>Center</strong> <strong>for</strong> <strong>Education</strong> <strong>Statistics</strong>, <strong>National</strong> <strong>Adult</strong> <strong>Literacy</strong> Survey, 1992.<br />
1<br />
2<br />
3<br />
4<br />
5<br />
QUANTITATIVE<br />
$230<br />
$274<br />
$345<br />
$472<br />
$681
