

Adult Literacy in America - National Center for Education Statistics ...
Adult Literacy in America - National Center for Education Statistics ...
Adult Literacy in America - National Center for Education Statistics ...

Create successful ePaper yourself
Turn your PDF publications into a flip-book with our unique Google optimized e-Paper software.
were <strong>in</strong>ferred from the per<strong>for</strong>mance of other adults with similar demographic<br />
backgrounds and fell <strong>in</strong> the middle range between the other two groups.<br />
Nearly all adults who correctly responded to at least one literacy task also<br />
completed the assessment. Still, some adults broke off the assessment after<br />
already hav<strong>in</strong>g shown some <strong>in</strong>itial success. Table 3.3 divides adults <strong>in</strong> Level 1<br />
who were successful with at least one task <strong>in</strong>to two groups: those who<br />
completed the assessment (at least five literacy tasks) and those who did not.<br />
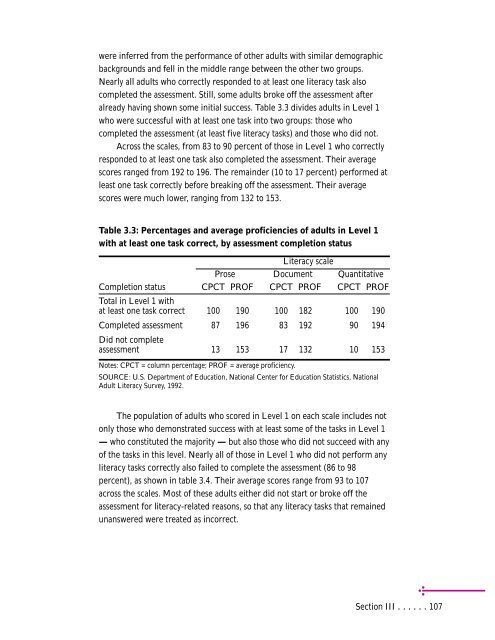
Across the scales, from 83 to 90 percent of those <strong>in</strong> Level 1 who correctly<br />
responded to at least one task also completed the assessment. Their average<br />
scores ranged from 192 to 196. The rema<strong>in</strong>der (10 to 17 percent) per<strong>for</strong>med at<br />
least one task correctly be<strong>for</strong>e break<strong>in</strong>g off the assessment. Their average<br />
scores were much lower, rang<strong>in</strong>g from 132 to 153.<br />
Table 3.3: Percentages and average proficiencies of adults <strong>in</strong> Level 1<br />
with at least one task correct, by assessment completion status<br />
Prose<br />
<strong>Literacy</strong> scale<br />
Document Quantitative<br />
Completion status<br />
Total <strong>in</strong> Level 1 with<br />
CPCT PROF CPCT PROF CPCT PROF<br />
at least one task correct 100 190 100 182 100 190<br />
Completed assessment<br />
Did not complete<br />
87 196 83 192 90 194<br />
assessment 13 153 17 132 10 153<br />
Notes: CPCT = column percentage; PROF = average proficiency.<br />
SOURCE: U.S. Department of <strong>Education</strong>, <strong>National</strong> <strong>Center</strong> <strong>for</strong> <strong>Education</strong> <strong>Statistics</strong>, <strong>National</strong><br />
<strong>Adult</strong> <strong>Literacy</strong> Survey, 1992.<br />
The population of adults who scored <strong>in</strong> Level 1 on each scale <strong>in</strong>cludes not<br />
only those who demonstrated success with at least some of the tasks <strong>in</strong> Level 1<br />
— who constituted the majority — but also those who did not succeed with any<br />
of the tasks <strong>in</strong> this level. Nearly all of those <strong>in</strong> Level 1 who did not per<strong>for</strong>m any<br />
literacy tasks correctly also failed to complete the assessment (86 to 98<br />
percent), as shown <strong>in</strong> table 3.4. Their average scores range from 93 to 107<br />
across the scales. Most of these adults either did not start or broke off the<br />
assessment <strong>for</strong> literacy-related reasons, so that any literacy tasks that rema<strong>in</strong>ed<br />
unanswered were treated as <strong>in</strong>correct.<br />
Section III ......107
