

Adult Literacy in America - National Center for Education Statistics ...
Adult Literacy in America - National Center for Education Statistics ...
Adult Literacy in America - National Center for Education Statistics ...

You also want an ePaper? Increase the reach of your titles
YUMPU automatically turns print PDFs into web optimized ePapers that Google loves.
NALS<br />
4<br />
3<br />
9<br />
12<br />
15<br />
15<br />
14<br />
8<br />
10<br />
7<br />
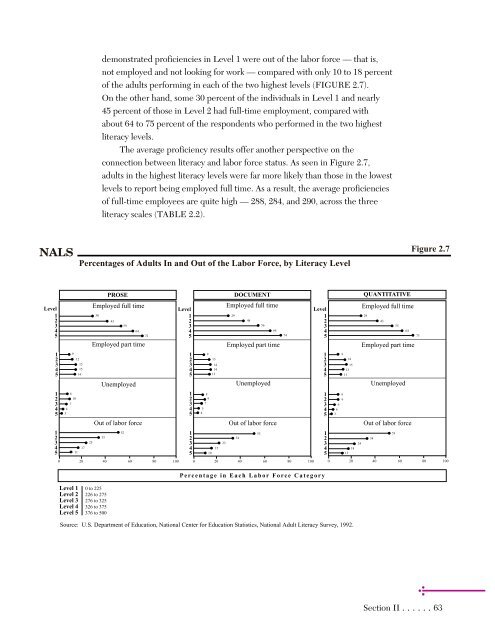
demonstrated proficiencies <strong>in</strong> Level 1 were out of the labor <strong>for</strong>ce — that is,<br />
not employed and not look<strong>in</strong>g <strong>for</strong> work — compared with only 10 to 18 percent<br />
of the adults per<strong>for</strong>m<strong>in</strong>g <strong>in</strong> each of the two highest levels (FIGURE 2.7).<br />
On the other hand, some 30 percent of the <strong>in</strong>dividuals <strong>in</strong> Level 1 and nearly<br />
45 percent of those <strong>in</strong> Level 2 had full-time employment, compared with<br />
about 64 to 75 percent of the respondents who per<strong>for</strong>med <strong>in</strong> the two highest<br />
literacy levels.<br />
The average proficiency results offer another perspective on the<br />
connection between literacy and labor <strong>for</strong>ce status. As seen <strong>in</strong> Figure 2.7,<br />
adults <strong>in</strong> the highest literacy levels were far more likely than those <strong>in</strong> the lowest<br />
levels to report be<strong>in</strong>g employed full time. As a result, the average proficiencies<br />
of full-time employees are quite high — 288, 284, and 290, across the three<br />
literacy scales (TABLE 2.2).<br />
Percentages of <strong>Adult</strong>s In and Out of the Labor Force, by <strong>Literacy</strong> Level<br />
PROSE DOCUMENT QUANTITATIVE<br />
Level Employed full time<br />
Level<br />
Employed full time<br />
Level<br />
Employed full time<br />
1<br />
2<br />
3<br />
4<br />
5<br />
30<br />
43<br />
54<br />
64<br />
72<br />
1<br />
2<br />
3<br />
4<br />
5<br />
29<br />
44<br />
56<br />
66<br />
74<br />
1<br />
2<br />
3<br />
4<br />
5<br />
29<br />
43<br />
55<br />
64<br />
Employed part time<br />
Employed part time Employed part time<br />
1<br />
2<br />
3<br />
4<br />
5<br />
1<br />
2<br />
3<br />
4<br />
5<br />
1<br />
2<br />
3<br />
4<br />
5<br />
17<br />
11<br />
25<br />
Unemployed<br />
Out of labor <strong>for</strong>ce Out of labor <strong>for</strong>ce Out of labor <strong>for</strong>ce<br />
35<br />
52<br />
1<br />
2<br />
3<br />
4<br />
5<br />
1<br />
2<br />
3<br />
4<br />
5<br />
1<br />
2<br />
3<br />
4<br />
5<br />
9<br />
8<br />
9<br />
7<br />
5<br />
4<br />
13<br />
14<br />
14<br />
13<br />
15<br />
10<br />
23<br />
Unemployed Unemployed<br />
34<br />
53<br />
1<br />
2<br />
3<br />
4<br />
5<br />
1<br />
2<br />
3<br />
4<br />
5<br />
1<br />
2<br />
3<br />
4<br />
5<br />
9<br />
9<br />
6<br />
4<br />
3<br />
9<br />
14<br />
15<br />
13<br />
11<br />
24<br />
18<br />
13<br />
34<br />
53<br />
Figure 2.7<br />
0 20 40 60 80 100 0 20 40 60 80 100 0 20 40 60 80 100<br />
Level 1 0 to 225<br />
Level 2 226 to 275<br />
Level 3 276 to 325<br />
Level 4 326 to 375<br />
Level 5 376 to 500<br />
Percentage <strong>in</strong> Each Labor Force Category<br />
Source: U.S. Department of <strong>Education</strong>, <strong>National</strong> <strong>Center</strong> <strong>for</strong> <strong>Education</strong> <strong>Statistics</strong>, <strong>National</strong> <strong>Adult</strong> <strong>Literacy</strong> Survey, 1992.<br />
Section II ......63<br />
73
