

Adult Literacy in America - National Center for Education Statistics ...
Adult Literacy in America - National Center for Education Statistics ...
Adult Literacy in America - National Center for Education Statistics ...

Create successful ePaper yourself
Turn your PDF publications into a flip-book with our unique Google optimized e-Paper software.
NALS<br />
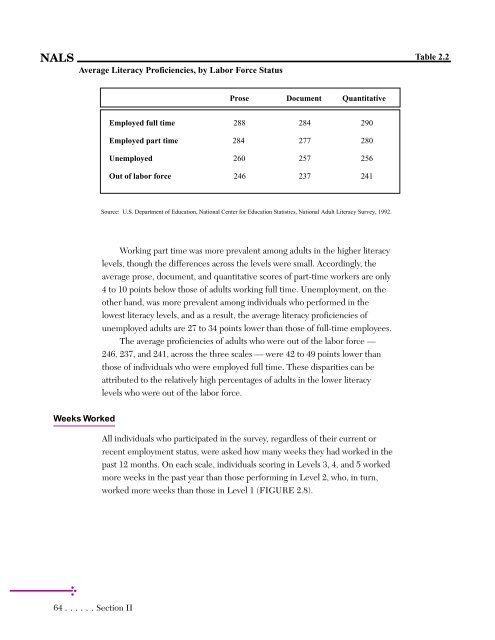
Average <strong>Literacy</strong> Proficiencies, by Labor Force Status<br />
Weeks Worked<br />
64 ......Section II<br />
Prose Document Quantitative<br />
Employed full time 288 284 290<br />
Employed part time 284 277 280<br />
Unemployed 260 257 256<br />
Out of labor <strong>for</strong>ce 246 237 241<br />
Source: U.S. Department of <strong>Education</strong>, <strong>National</strong> <strong>Center</strong> <strong>for</strong> <strong>Education</strong> <strong>Statistics</strong>, <strong>National</strong> <strong>Adult</strong> <strong>Literacy</strong> Survey, 1992.<br />
Work<strong>in</strong>g part time was more prevalent among adults <strong>in</strong> the higher literacy<br />
levels, though the differences across the levels were small. Accord<strong>in</strong>gly, the<br />
average prose, document, and quantitative scores of part-time workers are only<br />
4 to 10 po<strong>in</strong>ts below those of adults work<strong>in</strong>g full time. Unemployment, on the<br />
other hand, was more prevalent among <strong>in</strong>dividuals who per<strong>for</strong>med <strong>in</strong> the<br />
lowest literacy levels, and as a result, the average literacy proficiencies of<br />
unemployed adults are 27 to 34 po<strong>in</strong>ts lower than those of full-time employees.<br />
The average proficiencies of adults who were out of the labor <strong>for</strong>ce —<br />
246, 237, and 241, across the three scales — were 42 to 49 po<strong>in</strong>ts lower than<br />
those of <strong>in</strong>dividuals who were employed full time. These disparities can be<br />
attributed to the relatively high percentages of adults <strong>in</strong> the lower literacy<br />
levels who were out of the labor <strong>for</strong>ce.<br />
All <strong>in</strong>dividuals who participated <strong>in</strong> the survey, regardless of their current or<br />
recent employment status, were asked how many weeks they had worked <strong>in</strong> the<br />
past 12 months. On each scale, <strong>in</strong>dividuals scor<strong>in</strong>g <strong>in</strong> Levels 3, 4, and 5 worked<br />
more weeks <strong>in</strong> the past year than those per<strong>for</strong>m<strong>in</strong>g <strong>in</strong> Level 2, who, <strong>in</strong> turn,<br />
worked more weeks than those <strong>in</strong> Level 1 (FIGURE 2.8).<br />
Table 2.2
