

Adult Literacy in America - National Center for Education Statistics ...
Adult Literacy in America - National Center for Education Statistics ...
Adult Literacy in America - National Center for Education Statistics ...

Create successful ePaper yourself
Turn your PDF publications into a flip-book with our unique Google optimized e-Paper software.
CENSUS<br />
REGION<br />
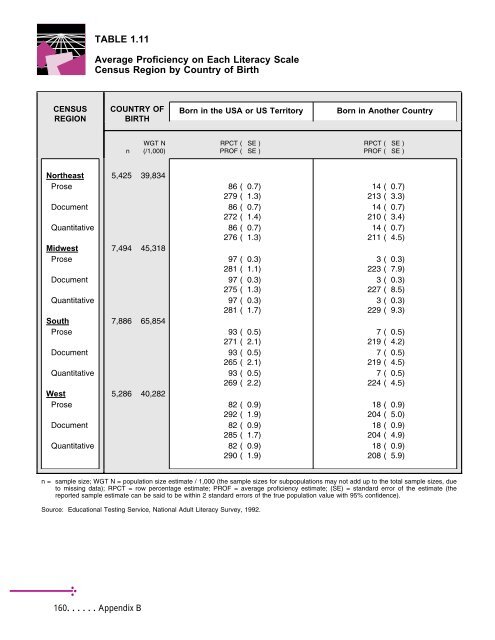
TABLE 1.11<br />
Average Proficiency on Each <strong>Literacy</strong> Scale<br />
Census Region by Country of Birth<br />
COUNTRY OF<br />
BIRTH<br />
160......Appendix B<br />
WGT N<br />
n (/1,000)<br />
RPCT ( SE )<br />
PROF ( SE )<br />
RPCT ( SE )<br />
PROF ( SE )<br />
Northeast 5,425 39,834<br />
Prose 86 ( 0.7) 14 ( 0.7)<br />
279 ( 1.3) 213 ( 3.3)<br />
Document 86 ( 0.7) 14 ( 0.7)<br />
272 ( 1.4) 210 ( 3.4)<br />
Quantitative 86 ( 0.7) 14 ( 0.7)<br />
276 ( 1.3) 211 ( 4.5)<br />
Midwest 7,494 45,318<br />
Prose 97 ( 0.3) 3 ( 0.3)<br />
281 ( 1.1) 223 ( 7.9)<br />
Document 97 ( 0.3) 3 ( 0.3)<br />
275 ( 1.3) 227 ( 8.5)<br />
Quantitative 97 ( 0.3) 3 ( 0.3)<br />
281 ( 1.7) 229 ( 9.3)<br />
South<br />
7,886 65,854<br />
Prose 93 ( 0.5) 7 ( 0.5)<br />
271 ( 2.1) 219 ( 4.2)<br />
Document 93 ( 0.5) 7 ( 0.5)<br />
265 ( 2.1) 219 ( 4.5)<br />
Quantitative 93 ( 0.5) 7 ( 0.5)<br />
269 ( 2.2) 224 ( 4.5)<br />
West<br />
5,286 40,282<br />
Prose 82 ( 0.9) 18 ( 0.9)<br />
292 ( 1.9) 204 ( 5.0)<br />
Document 82 ( 0.9) 18 ( 0.9)<br />
285 ( 1.7) 204 ( 4.9)<br />
Quantitative 82 ( 0.9) 18 ( 0.9)<br />
290 ( 1.9) 208 ( 5.9)<br />
n = sample size; WGT N = population size estimate / 1,000 (the sample sizes <strong>for</strong> subpopulations may not add up to the total sample sizes, due<br />
to miss<strong>in</strong>g data); RPCT = row percentage estimate; PROF = average proficiency estimate; (SE) = standard error of the estimate (the<br />
reported sample estimate can be said to be with<strong>in</strong> 2 standard errors of the true population value with 95% confidence).<br />
Source: <strong>Education</strong>al Test<strong>in</strong>g Service, <strong>National</strong> <strong>Adult</strong> <strong>Literacy</strong> Survey, 1992.<br />
Born <strong>in</strong> the USA or US Territory Born <strong>in</strong> Another Country
