

Adult Literacy in America - National Center for Education Statistics ...
Adult Literacy in America - National Center for Education Statistics ...
Adult Literacy in America - National Center for Education Statistics ...

Create successful ePaper yourself
Turn your PDF publications into a flip-book with our unique Google optimized e-Paper software.
138 ......Appendix B<br />
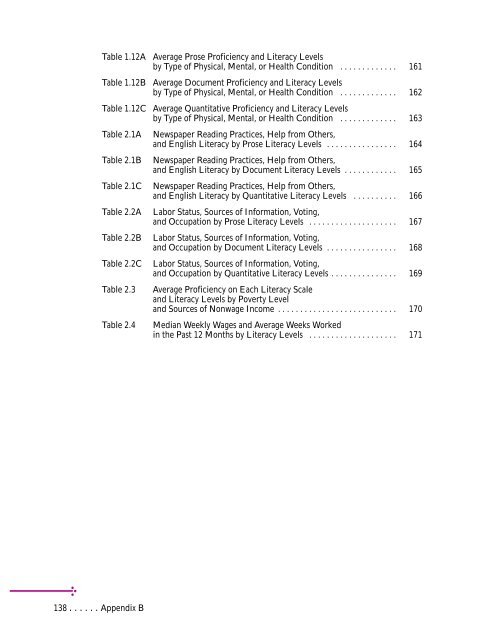
Table 1.12A Average Prose Proficiency and <strong>Literacy</strong> Levels<br />
by Type of Physical, Mental, or Health Condition . . . . . . . . . . . . . 161<br />
Table 1.12B Average Document Proficiency and <strong>Literacy</strong> Levels<br />
by Type of Physical, Mental, or Health Condition . . . . . . . . . . . . . 162<br />
Table 1.12C Average Quantitative Proficiency and <strong>Literacy</strong> Levels<br />
by Type of Physical, Mental, or Health Condition . . . . . . . . . . . . . 163<br />
Table 2.1A Newspaper Read<strong>in</strong>g Practices, Help from Others,<br />
and English <strong>Literacy</strong> by Prose <strong>Literacy</strong> Levels . . . . . . . . . . . . . . . . 164<br />
Table 2.1B Newspaper Read<strong>in</strong>g Practices, Help from Others,<br />
and English <strong>Literacy</strong> by Document <strong>Literacy</strong> Levels . . . . . . . . . . . . 165<br />
Table 2.1C Newspaper Read<strong>in</strong>g Practices, Help from Others,<br />
and English <strong>Literacy</strong> by Quantitative <strong>Literacy</strong> Levels . . . . . . . . . . 166<br />
Table 2.2A Labor Status, Sources of In<strong>for</strong>mation, Vot<strong>in</strong>g,<br />
and Occupation by Prose <strong>Literacy</strong> Levels . . . . . . . . . . . . . . . . . . . . 167<br />
Table 2.2B Labor Status, Sources of In<strong>for</strong>mation, Vot<strong>in</strong>g,<br />
and Occupation by Document <strong>Literacy</strong> Levels . . . . . . . . . . . . . . . . 168<br />
Table 2.2C Labor Status, Sources of In<strong>for</strong>mation, Vot<strong>in</strong>g,<br />
and Occupation by Quantitative <strong>Literacy</strong> Levels . . . . . . . . . . . . . . . 169<br />
Table 2.3 Average Proficiency on Each <strong>Literacy</strong> Scale<br />
and <strong>Literacy</strong> Levels by Poverty Level<br />
and Sources of Nonwage Income . . . . . . . . . . . . . . . . . . . . . . . . . . . 170<br />
Table 2.4 Median Weekly Wages and Average Weeks Worked<br />
<strong>in</strong> the Past 12 Months by <strong>Literacy</strong> Levels . . . . . . . . . . . . . . . . . . . . 171
