

Adult Literacy in America - National Center for Education Statistics ...
Adult Literacy in America - National Center for Education Statistics ...
Adult Literacy in America - National Center for Education Statistics ...

You also want an ePaper? Increase the reach of your titles
YUMPU automatically turns print PDFs into web optimized ePapers that Google loves.
Country of Birth and Racial/Ethnic Differences<br />
NALS<br />
40 ......Section I<br />
Many adults immigrate to the United States from places where English is not<br />
the national language. Not surpris<strong>in</strong>gly, <strong>in</strong>dividuals born <strong>in</strong> this country tend to<br />
be more proficient <strong>in</strong> English than those born outside of this country, who are<br />
likely to have learned English as a second language. To better understand the<br />
differences <strong>in</strong> per<strong>for</strong>mance among various racial/ethnic groups, then, it is<br />
helpful to exam<strong>in</strong>e the proportion of each group that was born <strong>in</strong>side and<br />
outside the United States.<br />
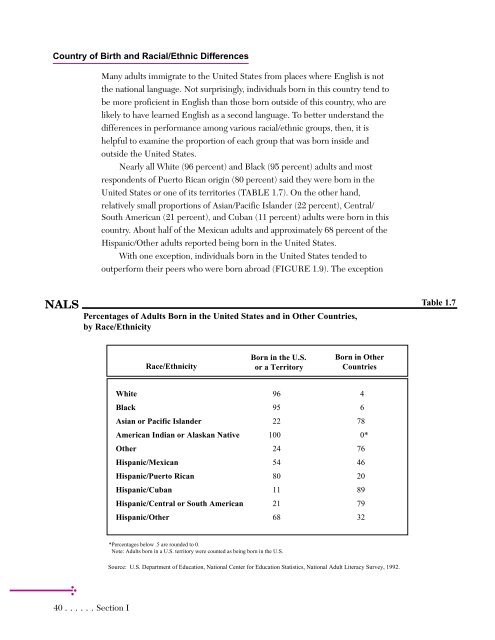
Nearly all White (96 percent) and Black (95 percent) adults and most<br />
respondents of Puerto Rican orig<strong>in</strong> (80 percent) said they were born <strong>in</strong> the<br />
United States or one of its territories (TABLE 1.7). On the other hand,<br />
relatively small proportions of Asian/Pacific Islander (22 percent), Central/<br />
South <strong>America</strong>n (21 percent), and Cuban (11 percent) adults were born <strong>in</strong> this<br />
country. About half of the Mexican adults and approximately 68 percent of the<br />
Hispanic/Other adults reported be<strong>in</strong>g born <strong>in</strong> the United States.<br />
With one exception, <strong>in</strong>dividuals born <strong>in</strong> the United States tended to<br />
outper<strong>for</strong>m their peers who were born abroad (FIGURE 1.9). The exception<br />
Percentages of <strong>Adult</strong>s Born <strong>in</strong> the United States and <strong>in</strong> Other Countries,<br />
by Race/Ethnicity<br />
Race/Ethnicity<br />
Born <strong>in</strong> the U.S.<br />
or a Territory<br />
Born <strong>in</strong> Other<br />
Countries<br />
White 96 4<br />
Black 95 6<br />
Asian or Pacific Islander 22 78<br />
<strong>America</strong>n Indian or Alaskan Native 100 0*<br />
Other 24 76<br />
Hispanic/Mexican 54 46<br />
Hispanic/Puerto Rican 80 20<br />
Hispanic/Cuban 11 89<br />
Hispanic/Central or South <strong>America</strong>n 21 79<br />
Hispanic/Other 68 32<br />
*Percentages below .5 are rounded to 0.<br />
Note: <strong>Adult</strong>s born <strong>in</strong> a U.S. territory were counted as be<strong>in</strong>g born <strong>in</strong> the U.S.<br />
Source: U.S. Department of <strong>Education</strong>, <strong>National</strong> <strong>Center</strong> <strong>for</strong> <strong>Education</strong> <strong>Statistics</strong>, <strong>National</strong> <strong>Adult</strong> <strong>Literacy</strong> Survey, 1992.<br />
Table 1.7
