

Adult Literacy in America - National Center for Education Statistics ...
Adult Literacy in America - National Center for Education Statistics ...
Adult Literacy in America - National Center for Education Statistics ...

Create successful ePaper yourself
Turn your PDF publications into a flip-book with our unique Google optimized e-Paper software.
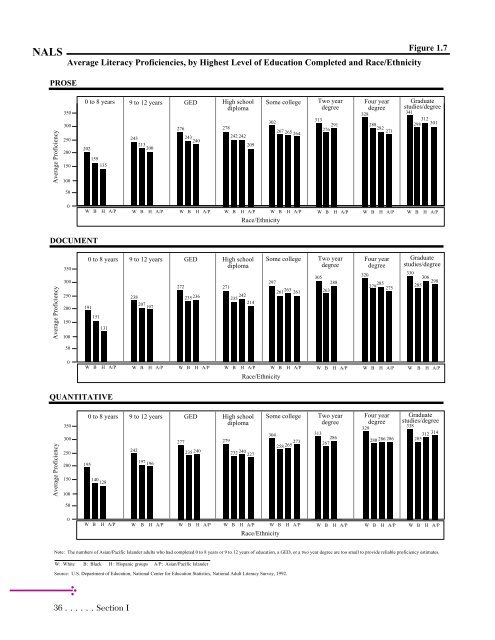
NALS<br />
PROSE<br />
Average Proficiency<br />
Average <strong>Literacy</strong> Proficiencies, by Highest Level of <strong>Education</strong> Completed and Race/Ethnicity<br />
350<br />
300<br />
250<br />
200<br />
150<br />
100<br />
50<br />
0<br />
0 to 8 years<br />
202<br />
DOCUMENT<br />
Average Proficiency<br />
350<br />
300<br />
250<br />
200<br />
150<br />
100<br />
50<br />
0<br />
159<br />
135<br />
36 ......Section I<br />
9 to 12 years<br />
243<br />
213<br />
200<br />
276<br />
GED<br />
243 240<br />
High school<br />
diploma<br />
278<br />
242 242<br />
209<br />
Some college<br />
302<br />
267 265 264<br />
Two year<br />
degree<br />
313<br />
276 291<br />
Four year<br />
degree<br />
328<br />
288<br />
282<br />
271<br />
W B H A/P W B H A/P W B H A/P W B H A/P W B H A/P W B H A/P W B H A/P<br />
0 to 8 years<br />
191<br />
151<br />
131<br />
QUANTITATIVE<br />
Average Proficiency<br />
350<br />
300<br />
250<br />
200<br />
150<br />
100<br />
50<br />
0<br />
9 to 12 years<br />
GED<br />
238 235<br />
207<br />
197<br />
236<br />
272 271<br />
High school<br />
diploma<br />
235 242<br />
214<br />
Some college<br />
297<br />
261 263 261<br />
Two year<br />
degree<br />
305<br />
263<br />
288<br />
Four year<br />
degree<br />
320<br />
279 285 275<br />
Figure 1.7<br />
Graduate<br />
studies/degree<br />
341<br />
312<br />
298 301<br />
Graduate<br />
studies/degree<br />
W B H A/P W B H A/P W B H A/P W B H A/P W B H A/P W B H A/P W B H A/P W B H A/P<br />
195<br />
0 to 8 years<br />
140 128<br />
9 to 12 years<br />
242<br />
197 196<br />
277<br />
GED<br />
235 240<br />
High school<br />
diploma<br />
279<br />
232 240 227<br />
Some college<br />
304<br />
273<br />
258 265<br />
Two year<br />
degree<br />
313<br />
286<br />
267<br />
Four year<br />
degree<br />
329<br />
280 286 286<br />
330<br />
285<br />
306 298<br />
Graduate<br />
studies/degree<br />
W B H A/P W B H A/P W B H A/P W B H A/P W B H A/P W B H A/P W B H A/P W B H A/P<br />
W: White B: Black H: Hispanic groups A/P: Asian/Pacific Islander<br />
Race/Ethnicity<br />
Race/Ethnicity<br />
Race/Ethnicity<br />
Source: U.S. Department of <strong>Education</strong>, <strong>National</strong> <strong>Center</strong> <strong>for</strong> <strong>Education</strong> <strong>Statistics</strong>, <strong>National</strong> <strong>Adult</strong> <strong>Literacy</strong> Survey, 1992.<br />
W B H A/P<br />
338<br />
312 314<br />
285<br />
Note: The numbers of Asian/Pacific Islander adults who had completed 0 to 8 years or 9 to 12 years of education, a GED, or a two year degree are too small to provide reliable proficiency estimates.
