

Adult Literacy in America - National Center for Education Statistics ...
Adult Literacy in America - National Center for Education Statistics ...
Adult Literacy in America - National Center for Education Statistics ...

Create successful ePaper yourself
Turn your PDF publications into a flip-book with our unique Google optimized e-Paper software.
NALS<br />
1<br />
2<br />
3<br />
4<br />
5<br />
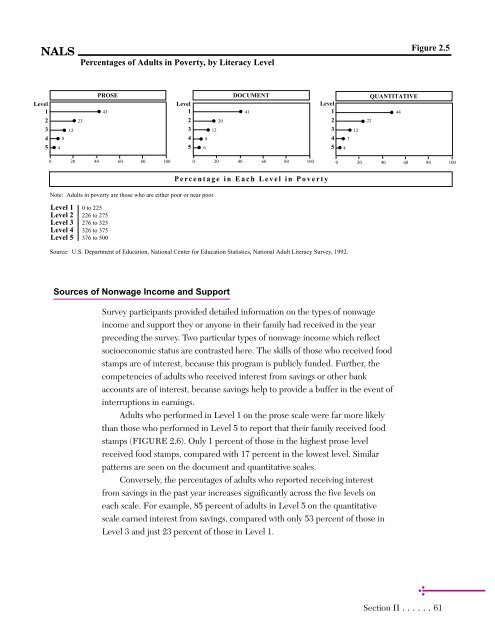
Percentages of <strong>Adult</strong>s <strong>in</strong> Poverty, by <strong>Literacy</strong> Level<br />
PROSE<br />
DOCUMENT<br />
Level Level<br />
43<br />
41<br />
23<br />
20<br />
8<br />
4<br />
12<br />
0 20 40 60 80 100<br />
Level<br />
1<br />
2<br />
3<br />
4<br />
5<br />
Note: <strong>Adult</strong>s <strong>in</strong> poverty are those who are either poor or near poor.<br />
Level 1 0 to 225<br />
Level 2 226 to 275<br />
Level 3 276 to 325<br />
Level 4 326 to 375<br />
Level 5 376 to 500<br />
Sources of Nonwage Income and Support<br />
6<br />
8<br />
12<br />
Figure 2.5<br />
0 20 40 60 80 100 0 20 40 60 80 100<br />
Percentage <strong>in</strong> Each Level <strong>in</strong> Poverty<br />
Source: U.S. Department of <strong>Education</strong>, <strong>National</strong> <strong>Center</strong> <strong>for</strong> <strong>Education</strong> <strong>Statistics</strong>, <strong>National</strong> <strong>Adult</strong> <strong>Literacy</strong> Survey, 1992.<br />
1<br />
2<br />
3<br />
4<br />
5<br />
4<br />
7<br />
12<br />
22<br />
QUANTITATIVE<br />
Survey participants provided detailed <strong>in</strong><strong>for</strong>mation on the types of nonwage<br />
<strong>in</strong>come and support they or anyone <strong>in</strong> their family had received <strong>in</strong> the year<br />
preced<strong>in</strong>g the survey. Two particular types of nonwage <strong>in</strong>come which reflect<br />
socioeconomic status are contrasted here. The skills of those who received food<br />
stamps are of <strong>in</strong>terest, because this program is publicly funded. Further, the<br />
competencies of adults who received <strong>in</strong>terest from sav<strong>in</strong>gs or other bank<br />
accounts are of <strong>in</strong>terest, because sav<strong>in</strong>gs help to provide a buffer <strong>in</strong> the event of<br />
<strong>in</strong>terruptions <strong>in</strong> earn<strong>in</strong>gs.<br />
<strong>Adult</strong>s who per<strong>for</strong>med <strong>in</strong> Level 1 on the prose scale were far more likely<br />
than those who per<strong>for</strong>med <strong>in</strong> Level 5 to report that their family received food<br />
stamps (FIGURE 2.6). Only 1 percent of those <strong>in</strong> the highest prose level<br />
received food stamps, compared with 17 percent <strong>in</strong> the lowest level. Similar<br />
patterns are seen on the document and quantitative scales.<br />
Conversely, the percentages of adults who reported receiv<strong>in</strong>g <strong>in</strong>terest<br />
from sav<strong>in</strong>gs <strong>in</strong> the past year <strong>in</strong>creases significantly across the five levels on<br />
each scale. For example, 85 percent of adults <strong>in</strong> Level 5 on the quantitative<br />
scale earned <strong>in</strong>terest from sav<strong>in</strong>gs, compared with only 53 percent of those <strong>in</strong><br />
Level 3 and just 23 percent of those <strong>in</strong> Level 1.<br />
44<br />
Section II ......61
