

Adult Literacy in America - National Center for Education Statistics ...
Adult Literacy in America - National Center for Education Statistics ...
Adult Literacy in America - National Center for Education Statistics ...

Create successful ePaper yourself
Turn your PDF publications into a flip-book with our unique Google optimized e-Paper software.
vi ......Contents<br />
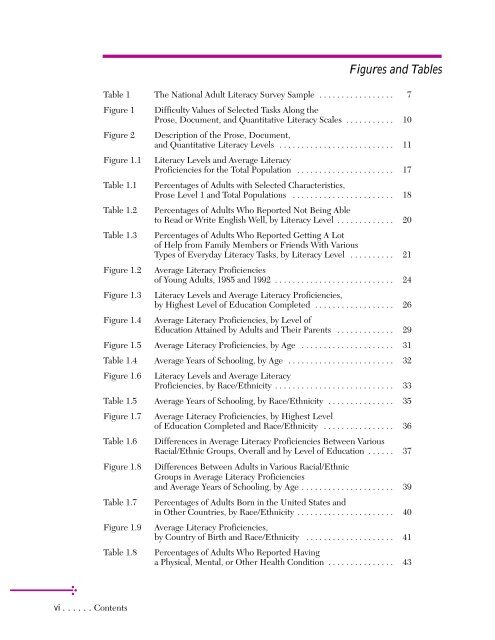
Figures and Tables<br />
Table 1 The <strong>National</strong> <strong>Adult</strong> <strong>Literacy</strong> Survey Sample . . . . . . . . . . . . . . . . . 7<br />
Figure 1 Difficulty Values of Selected Tasks Along the<br />
Prose, Document, and Quantitative <strong>Literacy</strong> Scales . . . . . . . . . . . 10<br />
Figure 2 Description of the Prose, Document,<br />
and Quantitative <strong>Literacy</strong> Levels . . . . . . . . . . . . . . . . . . . . . . . . . . 11<br />
Figure 1.1 <strong>Literacy</strong> Levels and Average <strong>Literacy</strong><br />
Proficiencies <strong>for</strong> the Total Population . . . . . . . . . . . . . . . . . . . . . . 17<br />
Table 1.1 Percentages of <strong>Adult</strong>s with Selected Characteristics,<br />
Prose Level 1 and Total Populations . . . . . . . . . . . . . . . . . . . . . . . 18<br />
Table 1.2 Percentages of <strong>Adult</strong>s Who Reported Not Be<strong>in</strong>g Able<br />
to Read or Write English Well, by <strong>Literacy</strong> Level . . . . . . . . . . . . . 20<br />
Table 1.3 Percentages of <strong>Adult</strong>s Who Reported Gett<strong>in</strong>g A Lot<br />
of Help from Family Members or Friends With Various<br />
Types of Everyday <strong>Literacy</strong> Tasks, by <strong>Literacy</strong> Level . . . . . . . . . . 21<br />
Figure 1.2 Average <strong>Literacy</strong> Proficiencies<br />
of Young <strong>Adult</strong>s, 1985 and 1992 . . . . . . . . . . . . . . . . . . . . . . . . . . . 24<br />
Figure 1.3 <strong>Literacy</strong> Levels and Average <strong>Literacy</strong> Proficiencies,<br />
by Highest Level of <strong>Education</strong> Completed . . . . . . . . . . . . . . . . . . 26<br />
Figure 1.4 Average <strong>Literacy</strong> Proficiencies, by Level of<br />
<strong>Education</strong> Atta<strong>in</strong>ed by <strong>Adult</strong>s and Their Parents . . . . . . . . . . . . . 29<br />
Figure 1.5 Average <strong>Literacy</strong> Proficiencies, by Age . . . . . . . . . . . . . . . . . . . . . 31<br />
Table 1.4 Average Years of School<strong>in</strong>g, by Age . . . . . . . . . . . . . . . . . . . . . . . . 32<br />
Figure 1.6 <strong>Literacy</strong> Levels and Average <strong>Literacy</strong><br />
Proficiencies, by Race/Ethnicity . . . . . . . . . . . . . . . . . . . . . . . . . . . 33<br />
Table 1.5 Average Years of School<strong>in</strong>g, by Race/Ethnicity . . . . . . . . . . . . . . . 35<br />
Figure 1.7 Average <strong>Literacy</strong> Proficiencies, by Highest Level<br />
of <strong>Education</strong> Completed and Race/Ethnicity . . . . . . . . . . . . . . . . 36<br />
Table 1.6 Differences <strong>in</strong> Average <strong>Literacy</strong> Proficiencies Between Various<br />
Racial/Ethnic Groups, Overall and by Level of <strong>Education</strong> . . . . . . 37<br />
Figure 1.8 Differences Between <strong>Adult</strong>s <strong>in</strong> Various Racial/Ethnic<br />
Groups <strong>in</strong> Average <strong>Literacy</strong> Proficiencies<br />
and Average Years of School<strong>in</strong>g, by Age . . . . . . . . . . . . . . . . . . . . . 39<br />
Table 1.7 Percentages of <strong>Adult</strong>s Born <strong>in</strong> the United States and<br />
<strong>in</strong> Other Countries, by Race/Ethnicity . . . . . . . . . . . . . . . . . . . . . . 40<br />
Figure 1.9 Average <strong>Literacy</strong> Proficiencies,<br />
by Country of Birth and Race/Ethnicity . . . . . . . . . . . . . . . . . . . . 41<br />
Table 1.8 Percentages of <strong>Adult</strong>s Who Reported Hav<strong>in</strong>g<br />
a Physical, Mental, or Other Health Condition . . . . . . . . . . . . . . . 43
