

Mitigation for the Construction and Operation of Libby Dam
Mitigation for the Construction and Operation of Libby Dam
Mitigation for the Construction and Operation of Libby Dam

You also want an ePaper? Increase the reach of your titles
YUMPU automatically turns print PDFs into web optimized ePapers that Google loves.
Table 12. Individual probability values (p values) resulting from analysis <strong>of</strong><br />
variance procedures that tested <strong>for</strong> differences in zooplankton densities by month<br />
(April – November), area (Tenmile, Rex<strong>for</strong>d <strong>and</strong> Canada) <strong>and</strong> a month by area<br />
interaction in 2003.<br />
Genus Month Area<br />
Month X<br />
Area<br />
Interaction<br />
Daphnia 4.01*10 -7 0.0093 0.1052<br />
Bosmina 3.25*10 -6 0.2553 1.56*10 -10<br />
Diaptomas 1.02*10 -7 0.0398 0.7331<br />
Cyclops 0.0333 0.0050 0.0500<br />
Leptodora 3.24*10 -10 0.0003 0.0082<br />
Epischura 1.56*10 -5 0.0118 0.2073<br />
Diaphanosoma 1.16*10 -6 0.2447 0.2555<br />
Proportion<br />
0.8<br />
0.7<br />
0.6<br />
0.5<br />
0.4<br />
0.3<br />
0.2<br />
0.1<br />
0<br />
1984<br />
1986<br />
1988<br />
1990<br />
1992<br />
1994<br />
1996<br />
1998<br />
2000<br />
2002<br />
Year<br />
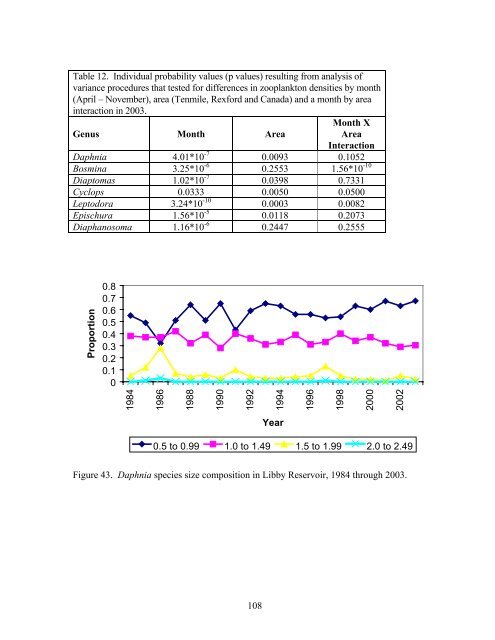
0.5 to 0.99 1.0 to 1.49 1.5 to 1.99 2.0 to 2.49<br />
Figure 43. Daphnia species size composition in <strong>Libby</strong> Reservoir, 1984 through 2003.<br />
108


