

Mitigation for the Construction and Operation of Libby Dam
Mitigation for the Construction and Operation of Libby Dam
Mitigation for the Construction and Operation of Libby Dam

You also want an ePaper? Increase the reach of your titles
YUMPU automatically turns print PDFs into web optimized ePapers that Google loves.
Catch per Trap-Day<br />
0.3<br />
0.25<br />
0.2<br />
0.15<br />
0.1<br />
0.05<br />
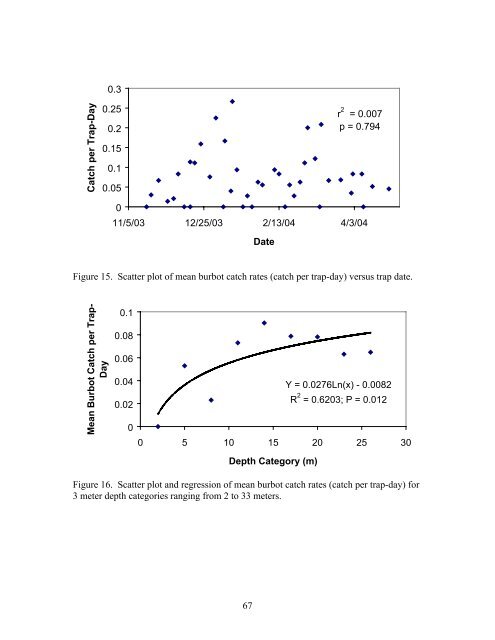
r 2 = 0.007<br />
p = 0.794<br />
0<br />
11/5/03 12/25/03 2/13/04 4/3/04<br />
Date<br />
Figure 15. Scatter plot <strong>of</strong> mean burbot catch rates (catch per trap-day) versus trap date.<br />
Mean Burbot Catch per Trap-<br />
Day<br />
0.1<br />
0.08<br />
0.06<br />
0.04<br />
0.02<br />
0<br />
Y = 0.0276Ln(x) - 0.0082<br />
R 2 = 0.6203; P = 0.012<br />
0 5 10 15 20 25 30<br />
Depth Category (m)<br />
Figure 16. Scatter plot <strong>and</strong> regression <strong>of</strong> mean burbot catch rates (catch per trap-day) <strong>for</strong><br />
3 meter depth categories ranging from 2 to 33 meters.<br />
67


