

Mitigation for the Construction and Operation of Libby Dam
Mitigation for the Construction and Operation of Libby Dam
Mitigation for the Construction and Operation of Libby Dam

You also want an ePaper? Increase the reach of your titles
YUMPU automatically turns print PDFs into web optimized ePapers that Google loves.
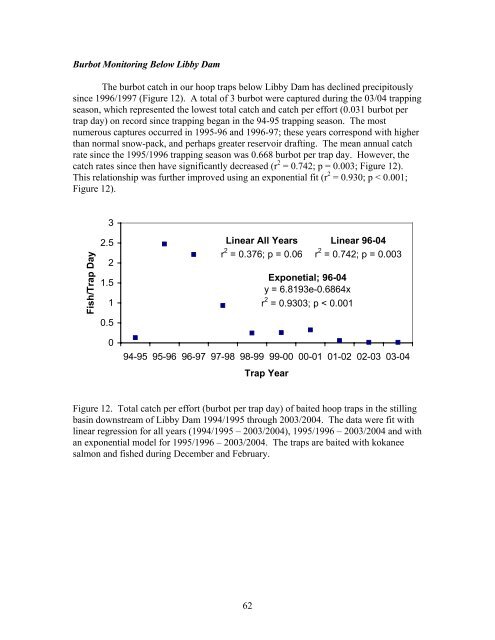
Burbot Monitoring Below <strong>Libby</strong> <strong>Dam</strong><br />
The burbot catch in our hoop traps below <strong>Libby</strong> <strong>Dam</strong> has declined precipitously<br />
since 1996/1997 (Figure 12). A total <strong>of</strong> 3 burbot were captured during <strong>the</strong> 03/04 trapping<br />
season, which represented <strong>the</strong> lowest total catch <strong>and</strong> catch per ef<strong>for</strong>t (0.031 burbot per<br />
trap day) on record since trapping began in <strong>the</strong> 94-95 trapping season. The most<br />
numerous captures occurred in 1995-96 <strong>and</strong> 1996-97; <strong>the</strong>se years correspond with higher<br />
than normal snow-pack, <strong>and</strong> perhaps greater reservoir drafting. The mean annual catch<br />
rate since <strong>the</strong> 1995/1996 trapping season was 0.668 burbot per trap day. However, <strong>the</strong><br />
catch rates since <strong>the</strong>n have significantly decreased (r 2 = 0.742; p = 0.003; Figure 12).<br />
This relationship was fur<strong>the</strong>r improved using an exponential fit (r 2 = 0.930; p < 0.001;<br />
Figure 12).<br />
3<br />
Fish/Trap Day<br />
2.5<br />
2<br />
1.5<br />
1<br />
0.5<br />
0<br />
Linear All Years<br />
r 2 = 0.376; p = 0.06<br />
Exponetial; 96-04<br />
y = 6.8193e-0.6864x<br />
r 2 = 0.9303; p < 0.001<br />
94-95 95-96 96-97 97-98 98-99 99-00 00-01 01-02 02-03 03-04<br />
Trap Year<br />
Linear 96-04<br />
r 2 = 0.742; p = 0.003<br />
Figure 12. Total catch per ef<strong>for</strong>t (burbot per trap day) <strong>of</strong> baited hoop traps in <strong>the</strong> stilling<br />
basin downstream <strong>of</strong> <strong>Libby</strong> <strong>Dam</strong> 1994/1995 through 2003/2004. The data were fit with<br />
linear regression <strong>for</strong> all years (1994/1995 – 2003/2004), 1995/1996 – 2003/2004 <strong>and</strong> with<br />
an exponential model <strong>for</strong> 1995/1996 – 2003/2004. The traps are baited with kokanee<br />
salmon <strong>and</strong> fished during December <strong>and</strong> February.<br />
62


