

Mitigation for the Construction and Operation of Libby Dam
Mitigation for the Construction and Operation of Libby Dam
Mitigation for the Construction and Operation of Libby Dam

Create successful ePaper yourself
Turn your PDF publications into a flip-book with our unique Google optimized e-Paper software.
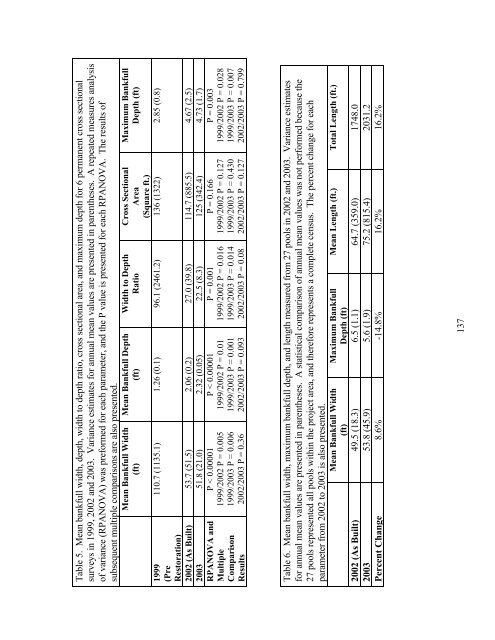
Table 5. Mean bankfull width, depth, width to depth ratio, cross sectional area, <strong>and</strong> maximum depth <strong>for</strong> 6 permanent cross sectional<br />
surveys in 1999, 2002 <strong>and</strong> 2003. Variance estimates <strong>for</strong> annual mean values are presented in paren<strong>the</strong>ses. A repeated measures analysis<br />
<strong>of</strong> variance (RPANOVA) was pre<strong>for</strong>med <strong>for</strong> each parameter, <strong>and</strong> <strong>the</strong> P value is presented <strong>for</strong> each RPANOVA. The results <strong>of</strong><br />
subsequent multiple comparisons are also presented.<br />
1999<br />
(Pre<br />
Mean Bankfull Width<br />
(ft)<br />
Mean Bankfull Depth<br />
(ft)<br />
Width to Depth<br />
Ratio<br />
Cross Sectional<br />
Area<br />
(Square ft.)<br />
Maximum Bankfull<br />
Depth (ft)<br />
110.7 (1135.1) 1.26 (0.1) 96.1 (2461.2) 136 (1322) 2.85 (0.8)<br />
Restoration)<br />
2002 (As Built) 53.7 (51.5) 2.06 (0.2) 27.0 (39.8) 114.7 (885.5) 4.67 (2.5)<br />
2003 51.8 (21.0) 2.32 (0.05) 22.5 (8.3) 125 (342.4) 4.73 (1.7)<br />
RPANOVA <strong>and</strong> P < 0.00001<br />
P < 0.00001<br />
P = 0.001<br />
P = 0.166<br />
Multiple 1999/2002 P = 0.005 1999/2002 P = 0.01 1999/2002 P = 0.016 1999/2002 P = 0.127<br />
Comparison 1999/2003 P = 0.006 1999/2003 P = 0.001 1999/2003 P = 0.014 1999/2003 P = 0.430<br />
Results<br />
2002/2003 P = 0.36 2002/2003 P = 0.093 2002/2003 P = 0.08 2002/2003 P = 0.127<br />
P = 0.003<br />
1999/2002 P = 0.028<br />
1999/2003 P = 0.007<br />
2002/2003 P = 0.799<br />
Table 6. Mean bankfull width, maximum bankfull depth, <strong>and</strong> length measured from 27 pools in 2002 <strong>and</strong> 2003. Variance estimates<br />
<strong>for</strong> annual mean values are presented in paren<strong>the</strong>ses. A statistical comparison <strong>of</strong> annual mean values was not per<strong>for</strong>med because <strong>the</strong><br />
27 pools represented all pools within <strong>the</strong> project area, <strong>and</strong> <strong>the</strong>re<strong>for</strong>e represents a complete census. The percent change <strong>for</strong> each<br />
parameter from 2002 to 2003 is also presented.<br />
Mean Bankfull Width<br />
(ft)<br />
Maximum Bankfull<br />
Depth (ft)<br />
Mean Length (ft.) Total Length (ft.)<br />
2002 (As Built) 49.5 (18.3) 6.5 (1.1) 64.7 (359.0) 1748.0<br />
2003 53.8 (45.9) 5.6 (1.9) 75.2 (815.4) 2031.2<br />
Percent Change 8.6% -14.8% 16.2% 16.2%<br />
137


