

Mitigation for the Construction and Operation of Libby Dam
Mitigation for the Construction and Operation of Libby Dam
Mitigation for the Construction and Operation of Libby Dam

You also want an ePaper? Increase the reach of your titles
YUMPU automatically turns print PDFs into web optimized ePapers that Google loves.
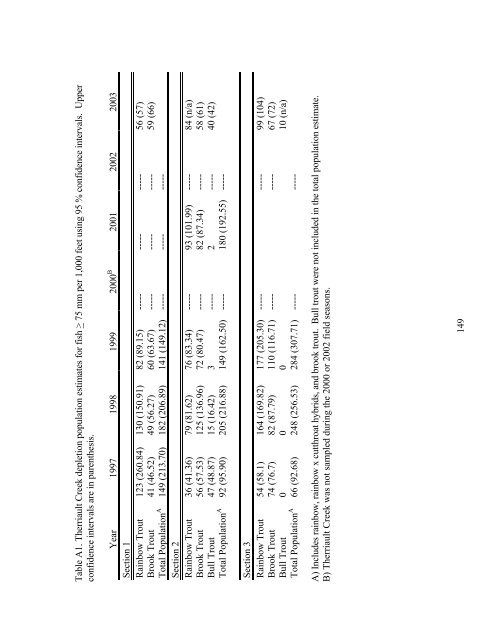
Table A1. Therriault Creek depletion population estimates <strong>for</strong> fish > 75 mm per 1,000 feet using 95 % confidence intervals. Upper<br />
confidence intervals are in paren<strong>the</strong>sis.<br />
Year 1997 1998 1999 2000B 2001 2002 2003<br />
Section 1<br />
Rainbow Trout 123 (260.84) 130 (150.91) 82 (89.15) ----- ----- ----- 56 (57)<br />
Brook Trout 41 (46.52) 49 (56.27) 60 (63.67) ----- ----- ----- 59 (66)<br />
Total Population A 149 (213.70) 182 (206.89) 141 (149.12) ----- ----- -----<br />
Section 2<br />
Rainbow Trout 36 (41.36) 79 (81.62) 76 (83.34) ----- 93 (101.99) ----- 84 (n/a)<br />
Brook Trout 56 (57.53) 125 (136.96) 72 (80.47) ----- 82 (87.34) ----- 58 (61)<br />
Bull Trout 47 (48.87) 15 (16.42) 3 ----- 2 ----- 40 (42)<br />
A<br />
Total Population 92 (95.90) 205 (216.88) 149 (162.50) ----- 180 (192.55) -----<br />
Section 3<br />
Rainbow Trout 54 (58.1) 164 (169.82) 177 (205.30) ----- ----- 99 (104)<br />
Brook Trout 74 (76.7) 82 (87.79) 110 (116.71) ----- ----- 67 (72)<br />
Bull Trout 0 0 0 10 (n/a)<br />
Total Population A 66 (92.68) 248 (256.53) 284 (307.71) ----- -----<br />
A) Includes rainbow, rainbow x cutthroat hybrids, <strong>and</strong> brook trout. Bull trout were not included in <strong>the</strong> total population estimate.<br />
B) Therriault Creek was not sampled during <strong>the</strong> 2000 or 2002 field seasons.<br />
149


