

Mitigation for the Construction and Operation of Libby Dam
Mitigation for the Construction and Operation of Libby Dam
Mitigation for the Construction and Operation of Libby Dam

Create successful ePaper yourself
Turn your PDF publications into a flip-book with our unique Google optimized e-Paper software.
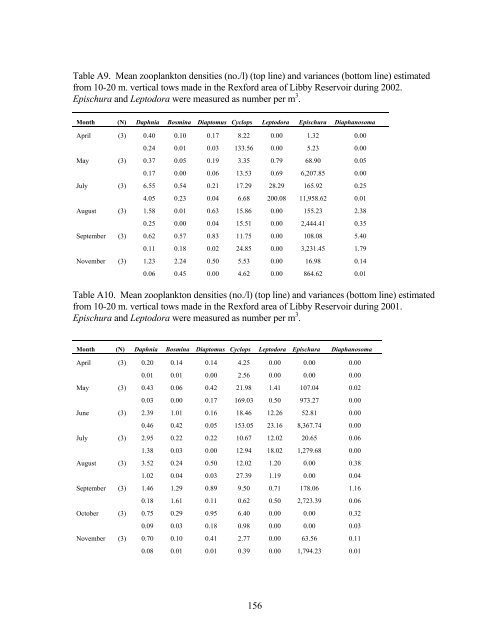
Table A9. Mean zooplankton densities (no./l) (top line) <strong>and</strong> variances (bottom line) estimated<br />
from 10-20 m. vertical tows made in <strong>the</strong> Rex<strong>for</strong>d area <strong>of</strong> <strong>Libby</strong> Reservoir during 2002.<br />
Epischura <strong>and</strong> Leptodora were measured as number per m 3 .<br />
Month (N) Daphnia Bosmina Diaptomus Cyclops Leptodora Epischura Diaphanosoma<br />
April (3) 0.40<br />
0.10<br />
0.17<br />
8.22<br />
0.00<br />
1.32<br />
0.00<br />
0.24<br />
0.01<br />
0.03<br />
133.56<br />
0.00<br />
5.23<br />
0.00<br />
May (3) 0.37<br />
0.05<br />
0.19<br />
3.35<br />
0.79<br />
68.90<br />
0.05<br />
0.17<br />
0.00<br />
0.06<br />
13.53<br />
0.69<br />
6,207.85<br />
0.00<br />
July (3) 6.55<br />
0.54<br />
0.21<br />
17.29<br />
28.29<br />
165.92<br />
0.25<br />
4.05<br />
0.23<br />
0.04 6.68<br />
200.08<br />
11,958.62<br />
0.01<br />
August (3) 1.58<br />
0.01<br />
0.63<br />
15.86<br />
0.00<br />
155.23<br />
2.38<br />
0.25<br />
0.00<br />
0.04<br />
15.51<br />
0.00<br />
2,444.41<br />
0.35<br />
September (3) 0.62<br />
0.57<br />
0.83<br />
11.75<br />
0.00<br />
108.08<br />
5.40<br />
0.11<br />
0.18<br />
0.02<br />
24.85<br />
0.00<br />
3,231.45<br />
1.79<br />
November (3) 1.23<br />
2.24<br />
0.50<br />
5.53<br />
0.00<br />
16.98<br />
0.14<br />
0.06<br />
0.45<br />
0.00<br />
4.62<br />
0.00<br />
864.62<br />
0.01<br />
Table A10. Mean zooplankton densities (no./l) (top line) <strong>and</strong> variances (bottom line) estimated<br />
from 10-20 m. vertical tows made in <strong>the</strong> Rex<strong>for</strong>d area <strong>of</strong> <strong>Libby</strong> Reservoir during 2001.<br />
Epischura <strong>and</strong> Leptodora were measured as number per m 3 .<br />
Month (N) Daphnia Bosmina Diaptomus Cyclops Leptodora Epischura Diaphanosoma<br />
April (3) 0.20<br />
0.01<br />
May (3) 0.43<br />
0.03<br />
June (3) 2.39<br />
0.46<br />
July (3) 2.95<br />
1.38<br />
August (3) 3.52<br />
1.02<br />
September (3) 1.46<br />
0.18<br />
October (3) 0.75<br />
0.09<br />
November (3) 0.70<br />
0.08<br />
0.14<br />
0.01<br />
0.14<br />
0.00<br />
4.25<br />
2.56<br />
0.00<br />
0.00<br />
0.00<br />
0.00<br />
0.00<br />
0.00<br />
0.06 0.42 21.98 1.41 107.04 0.02<br />
0.00 0.17 169.03 0.50 973.27 0.00<br />
1.01 0.16 18.46 12.26 52.81 0.00<br />
0.42 0.05 153.05 23.16 8,367.74 0.00<br />
0.22 0.22 10.67 12.02 20.65 0.06<br />
0.03 0.00 12.94 18.02 1,279.68 0.00<br />
0.24 0.50 12.02 1.20 0.00 0.38<br />
0.04 0.03 27.39 1.19 0.00 0.04<br />
1.29 0.89 9.50 0.71 178.06 1.16<br />
1.61 0.11 0.62 0.50 2,723.39 0.06<br />
0.29 0.95 6.40 0.00 0.00 0.32<br />
0.03 0.18 0.98 0.00 0.00 0.03<br />
0.10 0.41 2.77 0.00 63.56 0.11<br />
0.01 0.01 0.39 0.00 1,794.23 0.01<br />
156


