

Mitigation for the Construction and Operation of Libby Dam
Mitigation for the Construction and Operation of Libby Dam
Mitigation for the Construction and Operation of Libby Dam

Create successful ePaper yourself
Turn your PDF publications into a flip-book with our unique Google optimized e-Paper software.
Number Fish per 1000<br />
Feet<br />
100<br />
80<br />
60<br />
40<br />
20<br />
0<br />
Trend Analyses<br />
Cutthroat Trout r 2 = 0.05; p = 0.785<br />
Rainbow Trout r 2 = 0.754; p = 0.131<br />
Brook Trout r 2 = 0.529; p = 0.272<br />
Bull Trout r 2 = 0.510 p = 0.286<br />
2000 2001 2002 2003<br />
Years<br />
Cutthroat Trout Rainbow Trout Brook Trout Bull Trout<br />
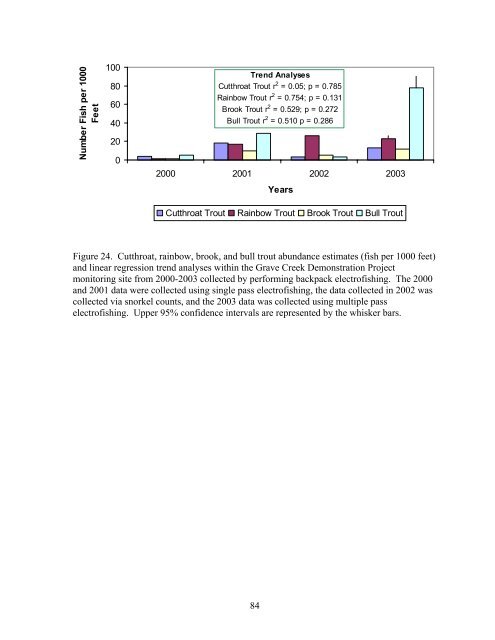
Figure 24. Cutthroat, rainbow, brook, <strong>and</strong> bull trout abundance estimates (fish per 1000 feet)<br />
<strong>and</strong> linear regression trend analyses within <strong>the</strong> Grave Creek Demonstration Project<br />
monitoring site from 2000-2003 collected by per<strong>for</strong>ming backpack electr<strong>of</strong>ishing. The 2000<br />
<strong>and</strong> 2001 data were collected using single pass electr<strong>of</strong>ishing, <strong>the</strong> data collected in 2002 was<br />
collected via snorkel counts, <strong>and</strong> <strong>the</strong> 2003 data was collected using multiple pass<br />
electr<strong>of</strong>ishing. Upper 95% confidence intervals are represented by <strong>the</strong> whisker bars.<br />
84


