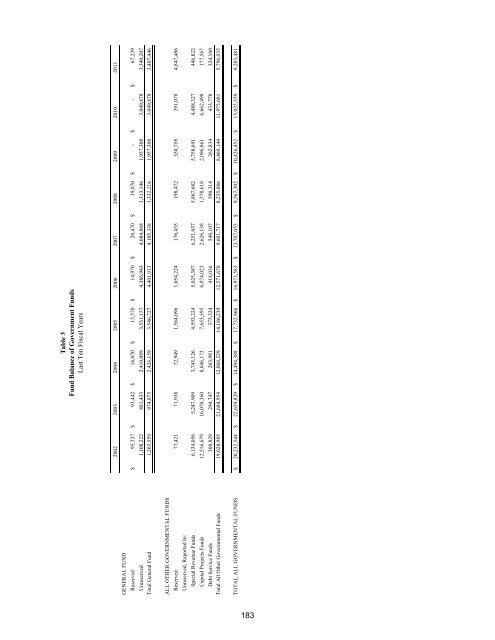
Table 3 Fund Balance <strong>of</strong> Government Funds Last Ten Fiscal Years GENERAL FUND 2002 2003 2004 2005 2006 2007 2008 2009 2010 2011 Reserved $ 95,337 $ 93,442 $ 16,070 $ 15,570 $ 14,970 $ 20,470 $ 19,070 $ - $ - $ 67,239 Unreserved 1,108,222 881,433 2,410,089 3,531,157 4,386,943 4,084,868 1,313,146 1,957,308 3,049,878 3,340,207 Total General Fund 1,203,559 974,875 2,426,159 3,546,727 4,401,913 4,105,338 1,332,216 1,957,308 3,049,878 3,407,446 ALL OTHER GOVERNMENTAL FUNDS Reserved 77,421 71,938 72,949 1,564,096 1,054,224 176,435 198,472 350,758 391,078 4,847,486 Unreserved, Reported In: Special Revenue Funds 6,134,056 5,247,909 3,745,126 4,593,224 5,025,387 6,251,037 5,867,682 5,758,691 4,488,327 446,822 Capital Projects Funds 12,516,679 16,070,360 8,046,173 7,653,595 6,074,023 2,626,138 1,578,618 2,096,861 6,662,498 177,567 Debt Service Funds 300,829 294,747 203,981 375,324 418,036 548,107 590,314 262,834 433,778 324,160 Total All Other Governmental Funds 19,028,985 21,684,954 12,068,229 14,186,239 12,571,670 9,601,717 8,235,086 8,469,144 11,975,681 5,796,035 TOTAL ALL GOVERNMENTAL FUNDS $ 20,232,544 $ 22,659,829 $ 14,494,388 $ 17,732,966 $ 16,973,583 $ 13,707,055 $ 9,567,302 $ 10,426,452 $ 15,025,559 $ 9,203,481 183
Table 4 Changes in Fund Balances <strong>of</strong> Government Funds Last Ten Fiscal Years 2003 2004 2005 2006 2007 2008 2009 2010 2011 REVENUES Taxes $ 21,066,589 $ 22,219,675 $ 23,762,468 $ 25,423,632 $ 26,572,963 $ 25,132,935 $ 24,259,262 $ 23,958,593 $ 24,139,778 Licenses and Permits 720,506 862,913 1,138,578 1,043,642 1,160,778 1,037,771 1,174,918 1,165,394 1,233,719 Intergovernmental 10,292,514 11,907,911 4,665,774 10,574,163 10,004,467 8,846,813 8,126,087 8,266,451 5,650,308 Charges for services 3,467,422 3,795,272 4,647,098 5,214,339 4,645,238 5,005,728 5,188,790 5,648,907 4,950,225 Fines and forfeits 833,772 751,536 721,703 868,427 1,022,563 1,689,080 1,929,836 1,581,937 1,536,690 Miscellaneous 1,762,139 1,681,959 2,634,054 3,101,742 3,107,379 2,497,255 1,636,519 2,962,238 1,706,691 Total Revenues 38,142,942 41,219,266 37,569,675 46,225,945 46,513,388 44,209,582 42,315,412 43,583,520 39,217,411 EXPENDITURES Current General Government 5,446,515 5,176,259 5,097,706 5,628,413 6,389,555 6,830,197 6,793,202 6,878,458 7,237,760 Public Safety 14,622,354 13,493,936 14,817,115 15,516,122 17,418,932 21,205,949 22,222,451 22,369,568 21,787,632 Utilities and Environment 193,048 195,122 195,461 217,600 374,985 223,469 226,975 219,431 219,631 Transportation 3,715,299 3,350,876 2,945,199 6,295,350 7,652,880 7,401,334 3,372,750 3,010,848 3,135,657 Economic environment 2,239,290 3,003,305 2,576,379 2,795,953 2,521,648 3,142,196 1,950,417 3,269,259 2,292,909 Mental/physical health 180,743 185,612 68,131 71,285 71,379 73,525 74,922 75,126 75,573 Culture and recreation 3,131,506 4,121,492 4,327,569 4,873,362 5,313,236 5,357,250 4,548,291 4,867,545 4,364,162 Debt Service: Principal 714,000 737,500 1,060,863 1,367,000 1,562,499 986,000 1,035,500 771,500 1,382,500 Interest and other debt issue costs 1,099,157 1,190,262 1,367,191 1,409,746 1,363,534 1,165,883 946,444 964,772 1,402,902 Capital 16,622,050 17,842,919 4,022,693 10,722,720 8,090,180 4,515,778 4,874,658 9,361,248 7,256,768 Intergovernmental Payments - - - - - - - - 42,203 Total Expenditures 47,963,962 49,297,283 36,478,307 48,897,551 50,758,828 50,901,581 46,045,610 51,787,755 49,197,697 Excess (deficiency) <strong>of</strong> revenues (9,821,020) (8,078,017) 1,091,368 (2,671,606) (4,245,440) (6,691,999) (3,730,198) (8,204,235) (9,980,286) over (under) expenditures OTHER FINANCING SOURCES (USES) Proceeds <strong>of</strong> Long Term Debt 10,865,000 800,000 1,671,000 - - - - 19,407,267 9,675,000 Payments to Refunded Escrow Agent - - (1,661,309) - - - - (10,387,010) (9,675,000) Capital Asset Donation & Disposal - 5,958 2,659,534 2,700,538 1,467,967 428,319 398,759 40,930 511,823 Insurance Recoveries - - - - - - 14,664 18,629 1,251 Transfers in 5,075,298 4,955,598 6,377,743 9,768,469 8,957,389 6,461,827 7,415,810 5,630,979 6,921,147 Transfers out (3,753,180) (5,705,285) (6,885,610) (10,596,716) (9,445,689) (4,195,667) (3,239,886) (2,020,214) (3,282,833) Total other financing sources and uses 12,187,118 56,271 2,161,358 1,872,291 979,667 2,694,479 4,589,347 12,690,581 4,151,388 OTHER CHANGES IN FUND BALANCE Change in Reserves for Inventory (10,023) (72,486) (14,148) 39,932 (755) (1,507) - (10,666) 6,820 Net change in fund balances 2,356,075 (8,094,232) 3,238,578 (759,383) (3,266,528) (3,999,027) 859,149 4,475,680 (5,822,078) Fund balances-beginning 20,232,545 22,588,620 14,494,388 17,732,966 16,973,583 13,707,055 9,567,302 10,426,451 15,025,559 Prior Period Adjustments - - - - - (140,726) - 123,428 - Fund balances-ending $ 22,588,620 $ 14,494,388 $ 17,732,966 $ 16,973,583 $ 13,707,055 $ 9,567,302 $ 10,426,451 $ 15,025,559 $ 9,203,481 Debt service as a percentage <strong>of</strong> non-capital expenditures 5.79% 6.13% 7.48% 7.27% 6.86% 4.64% 4.81% 4.09% 6.64% 25,000,000 20,000,000 Beginning Fund Balance Ending Fund Balance 15,000,000 10,000,000 5,000,000 - 2003 2004 2005 2006 2007 2008 2009 2010 2011 184