2013 Annual Budget - City of Bremerton
2013 Annual Budget - City of Bremerton
2013 Annual Budget - City of Bremerton

You also want an ePaper? Increase the reach of your titles
YUMPU automatically turns print PDFs into web optimized ePapers that Google loves.
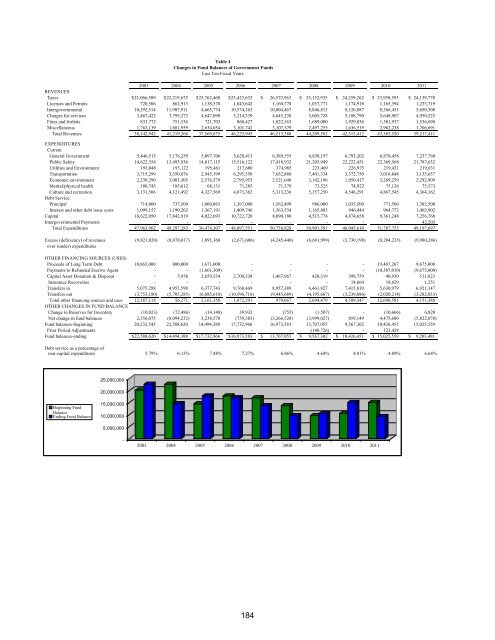
Table 4<br />
Changes in Fund Balances <strong>of</strong> Government Funds<br />
Last Ten Fiscal Years<br />
2003 2004 2005 2006 2007 2008 2009 2010 2011<br />
REVENUES<br />
Taxes $ 21,066,589 $ 22,219,675 $ 23,762,468 $ 25,423,632 $ 26,572,963 $ 25,132,935 $ 24,259,262 $ 23,958,593 $ 24,139,778<br />
Licenses and Permits 720,506 862,913 1,138,578 1,043,642 1,160,778 1,037,771 1,174,918 1,165,394 1,233,719<br />
Intergovernmental 10,292,514 11,907,911 4,665,774 10,574,163 10,004,467 8,846,813 8,126,087 8,266,451 5,650,308<br />
Charges for services 3,467,422 3,795,272 4,647,098 5,214,339 4,645,238 5,005,728 5,188,790 5,648,907 4,950,225<br />
Fines and forfeits 833,772 751,536 721,703 868,427 1,022,563 1,689,080 1,929,836 1,581,937 1,536,690<br />
Miscellaneous 1,762,139 1,681,959 2,634,054 3,101,742 3,107,379 2,497,255 1,636,519 2,962,238 1,706,691<br />
Total Revenues 38,142,942 41,219,266 37,569,675 46,225,945 46,513,388 44,209,582 42,315,412 43,583,520 39,217,411<br />
EXPENDITURES<br />
Current<br />
General Government 5,446,515 5,176,259 5,097,706 5,628,413 6,389,555 6,830,197 6,793,202 6,878,458 7,237,760<br />
Public Safety 14,622,354 13,493,936 14,817,115 15,516,122 17,418,932 21,205,949 22,222,451 22,369,568 21,787,632<br />
Utilities and Environment 193,048 195,122 195,461 217,600 374,985 223,469 226,975 219,431 219,631<br />
Transportation 3,715,299 3,350,876 2,945,199 6,295,350 7,652,880 7,401,334 3,372,750 3,010,848 3,135,657<br />
Economic environment 2,239,290 3,003,305 2,576,379 2,795,953 2,521,648 3,142,196 1,950,417 3,269,259 2,292,909<br />
Mental/physical health 180,743 185,612 68,131 71,285 71,379 73,525 74,922 75,126 75,573<br />
Culture and recreation 3,131,506 4,121,492 4,327,569 4,873,362 5,313,236 5,357,250 4,548,291 4,867,545 4,364,162<br />
Debt Service:<br />
Principal 714,000 737,500 1,060,863 1,367,000 1,562,499 986,000 1,035,500 771,500 1,382,500<br />
Interest and other debt issue costs 1,099,157 1,190,262 1,367,191 1,409,746 1,363,534 1,165,883 946,444 964,772 1,402,902<br />
Capital 16,622,050 17,842,919 4,022,693 10,722,720 8,090,180 4,515,778 4,874,658 9,361,248 7,256,768<br />
Intergovernmental Payments - - - - - - - - 42,203<br />
Total Expenditures 47,963,962 49,297,283 36,478,307 48,897,551 50,758,828 50,901,581 46,045,610 51,787,755 49,197,697<br />
Excess (deficiency) <strong>of</strong> revenues (9,821,020) (8,078,017) 1,091,368 (2,671,606) (4,245,440) (6,691,999) (3,730,198) (8,204,235) (9,980,286)<br />
over (under) expenditures<br />
OTHER FINANCING SOURCES (USES)<br />
Proceeds <strong>of</strong> Long Term Debt 10,865,000 800,000 1,671,000 - - - - 19,407,267 9,675,000<br />
Payments to Refunded Escrow Agent - - (1,661,309) - - - - (10,387,010) (9,675,000)<br />
Capital Asset Donation & Disposal - 5,958 2,659,534 2,700,538 1,467,967 428,319 398,759 40,930 511,823<br />
Insurance Recoveries - - - - - - 14,664 18,629 1,251<br />
Transfers in 5,075,298 4,955,598 6,377,743 9,768,469 8,957,389 6,461,827 7,415,810 5,630,979 6,921,147<br />
Transfers out (3,753,180) (5,705,285) (6,885,610) (10,596,716) (9,445,689) (4,195,667) (3,239,886) (2,020,214) (3,282,833)<br />
Total other financing sources and uses 12,187,118 56,271 2,161,358 1,872,291 979,667 2,694,479 4,589,347 12,690,581 4,151,388<br />
OTHER CHANGES IN FUND BALANCE<br />
Change in Reserves for Inventory (10,023) (72,486) (14,148) 39,932 (755) (1,507) - (10,666) 6,820<br />
Net change in fund balances 2,356,075 (8,094,232) 3,238,578 (759,383) (3,266,528) (3,999,027) 859,149 4,475,680 (5,822,078)<br />
Fund balances-beginning 20,232,545 22,588,620 14,494,388 17,732,966 16,973,583 13,707,055 9,567,302 10,426,451 15,025,559<br />
Prior Period Adjustments - - - - - (140,726) - 123,428 -<br />
Fund balances-ending $ 22,588,620 $ 14,494,388 $ 17,732,966 $ 16,973,583 $ 13,707,055 $ 9,567,302 $ 10,426,451 $ 15,025,559 $ 9,203,481<br />
Debt service as a percentage <strong>of</strong><br />
non-capital expenditures 5.79% 6.13% 7.48% 7.27% 6.86% 4.64% 4.81% 4.09% 6.64%<br />
25,000,000<br />
20,000,000<br />
Beginning Fund<br />
Balance<br />
Ending Fund Balance<br />
15,000,000<br />
10,000,000<br />
5,000,000<br />
-<br />
2003 2004 2005 2006 2007 2008 2009 2010 2011<br />
184