Technical Report - International Military Testing Association
Technical Report - International Military Testing Association
Technical Report - International Military Testing Association

Create successful ePaper yourself
Turn your PDF publications into a flip-book with our unique Google optimized e-Paper software.
. .<br />
.<br />
_. .- --\<br />
..-._-_- . .._<br />
;--. . :<br />
.: ‘.<br />
. .<br />
‘,<br />
(- . .<br />
.<br />
.<br />
. .<br />
I<br />
.<br />
‘._ *<br />
-. 2’. -.‘.<br />
. s<br />
_ _. -.- : .--..- .: -.._..- -- ..--;-A---- -___ ._<br />
.<br />
1<br />
I<br />
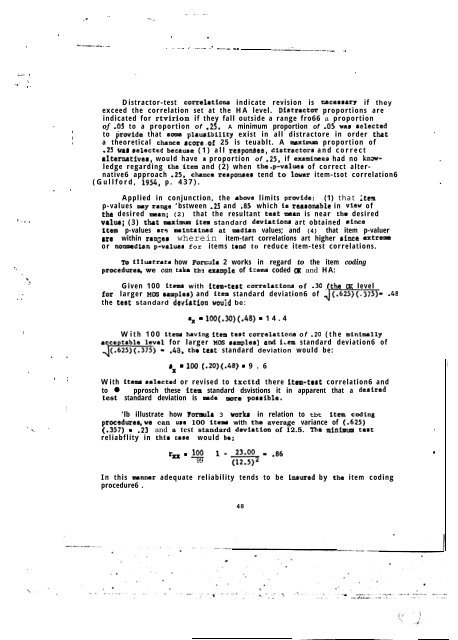
Distractor-test corralstions indicate revision is ctcessarp if they<br />
exceed the correlation set at the HA level. Distractor proportions are<br />
indicated for rtvirion if they fall outside a range fro66 a proportion<br />
of .OS to a proportion of .25. A minimum proportion of .OS wnd elected<br />
to provide that scm6 plausiboility exist in all distractore in order thut<br />
a theoretical chaacS6 scort.of 25 is teuablt. A msxinarn proportion of<br />
.25 wa6 btltcted becauat (1) all rc6pons6s, distractox and correct<br />
*<br />
altemativts, would have s proportion of .25, if examinaao had no icnm- .<br />
ledge regarding the item and (2) when the.p-values of correct alter- ’<br />
native6 approach .25, chance rc6ponses tend to lovar item-tsot correlation6<br />
(Gullford, 1956, p. 437). .<br />
. *<br />
. .<br />
Applied in conjunction, the above limits provide: (1) that :tem<br />
p-values lrvy range ‘bstween .25 and .85 which ie rearonsble in view of<br />
the desired man; (2) that the resultant test mssu is near the desired<br />
valus; (3) that wximm item standard deviation8 art obtained rince<br />
item p-values am msintainsd at andiaa values; and (4) that item p-valuer<br />
trt within ranpr wherein item-tart correlations art higher since extrexe<br />
or nonmedian p-valu66 for items tend to reduce item-test correlations.<br />
To iIlu6trata how Ponda 2 works in regard to the item coding<br />
proctdurtt, we can take th? txmple of ittw coded CX and HA:<br />
Given 100 item6 with item-ttrt corrtlacions of .30 (the tX level<br />
for larger NCS 8+6ples) and item standard deviation6 of4-9<br />
.48<br />
the test standard dfmfation would be:<br />
Ix - 100(.30)(.48) - 14.4<br />
With 100 item having itmn ta6t correlationa of .20 (the minimslly<br />
for larger HGS ramplea) aud i-em standard deviation6 of<br />
.48, the test standard deviation would be:<br />
sx - 100 (.20)(.48) - 9 . 6<br />
’ ; With item 6tleCttd or revised to txcttd there item-test correlation6 and<br />
to � pprosch these item standard dsvistions it in apparent that a daairtd<br />
test standard deviation is tmdt more posriblt.<br />
!<br />
‘lb illustrate how ?oxw~la 3 worka in relation to tbt item coding<br />
procrdurtr,wt can use 100 items with the average variance of (.625)<br />
(.357) - .23 and a test standard dwiation of 12.5. The miniatum tt6t<br />
reliabflity in thir cast would be:<br />
rxx - loo<br />
99<br />
l-.=&-.86<br />
In this msnner adequate reliability tends to be iasursd by the item coding<br />
procedure6 .<br />
48<br />
.<br />
.<br />
.<br />
i