Equity and Liabilities (euros) note 12/31/<strong>2011</strong> of which related parties 12/31/2010 of which related parties Equity Share capital issued 10,693,628,019 10,688,746,057 less: treasury shares (20,719,608) (20,719,608) Share capital 10,672,908,411 10,668,026,449 Paid-in capital 1,703,973,470 1,697,291,880 Legal reserve 2,137,749,211 2,134,773,036 Other reserves Reserve L.D. 124/93 ex art. 13 391,352 391,352 Reserve D.P.R. 917/86 ex art. 74 5,749,710 5,749,710 Reserve for capital grants 602,258,804 602,258,804 Revaluation reserve ex lege 413/91 1,128,827 1,128,827 Reserve Law 266/2005, ex art.1, para. 469 - Law 342/2000 ex art. 14 315,842,091 315,842,091 Other 2,169,346,211 2,435,360,386 Total Other reserves 3,094,716,995 3,360,731,170 Retained earnings (Accumulated losses), including profit (loss) for the year 2,927,572,168 7,703,044,667 Total Equity (a) 12) 20,536,920,255 25,563,867,202 Non-current liabilities Non-current financial liabilities 13) 34,941,182,483 12,612,211,000 37,153,689,168 16,973,884,000 Employee benefits 18) 741,117,415 967,755,737 Deferred tax liabilities 9) 799,999 1,190,414 Provisions 19) 467,983,806 484,653,167 Miscellaneous payables and other noncurrent liabilities 20) 584,706,898 41,767,000 675,435,891 41,685,000 Total Non-current liabilities (b) 36,735,790,601 39,282,724,377 Current liabilities Current financial liabilities 13) 7,289,900,538 3,520,352,000 6,055,929,791 3,849,856,000 Trade and miscellaneous payables and other current liabilities 21) 7,528,019,329 725,473,000 7,689,642,562 836,712,000 Current income tax payables 9) 62,668,507 34,030,727 Total Current liabilities (c) 14,880,588,374 13,779,603,080 Total Liabilities (d=b+c) 51,616,378,975 53,062,327,457 Total Equity and Liabilities (a+d) 72,153,299,230 78,626,194,659 <strong>Telecom</strong> <strong>Italia</strong> S.p.A. Separate Financial Statements Statements of Financial Position 306
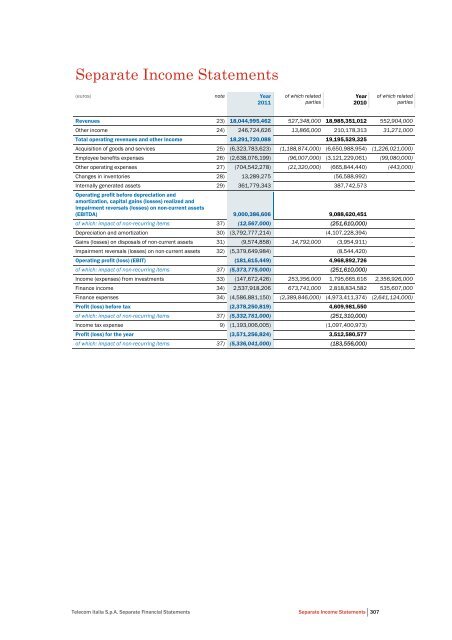
Separate Income Statements (euros) note Year <strong>2011</strong> of which related parties Year 2010 of which related parties Revenues 23) 18,044,995,462 527,348,000 18,985,351,012 552,904,000 Other income 24) 246,724,626 13,866,000 210,178,313 31,271,000 Total operating revenues and other income 18,291,720,088 19,195,529,325 Acquisition of goods and services 25) (6,323,783,623) (1,188,874,000) (6,650,988,954) (1,226,021,000) Employee benefits expenses 26) (2,638,076,199) (96,007,000) (3,121,229,061) (99,080,000) Other operating expenses 27) (704,542,278) (21,320,000) (665,844,440) (443,000) Changes in inven<strong>to</strong>ries 28) 13,289,275 (56,588,992) Internally generated assets 29) 361,779,343 387,742,573 Operating profit before depreciation and amortization, capital gains (losses) realized and impairment reversals (losses) on non-current assets (EBITDA) 9,000,386,606 9,088,620,451 of which: impact of non-recurring items 37) (12,567,000) (251,610,000) Depreciation and amortization 30) (3,792,777,214) (4,107,228,394) Gains (losses) on disposals of non-current assets 31) (9,574,858) 14,792,000 (3,954,911) - Impairment reversals (losses) on non-current assets 32) (5,379,649,984) (8,544,420) Operating profit (loss) (EBIT) (181,615,449) 4,968,892,726 of which: impact of non-recurring items 37) (5,373,775,000) (251,610,000) Income (expenses) from investments 33) (147,672,426) 253,356,000 1,795,665,616 2,356,926,000 Finance income 34) 2,537,918,206 673,741,000 2,818,834,582 535,607,000 Finance expenses 34) (4,586,881,150) (2,389,846,000) (4,973,411,374) (2,641,124,000) Profit (loss) before tax (2,378,250,819) 4,609,981,550 of which: impact of non-recurring items 37) (5,332,781,000) (251,310,000) Income tax expense 9) (1,193,006,005) (1,097,400,973) Profit (loss) for the year (3,571,256,824) 3,512,580,577 of which: impact of non-recurring items 37) (5,336,041,000) (183,556,000) <strong>Telecom</strong> <strong>Italia</strong> S.p.A. Separate Financial Statements Separate Income Statements 307
- Page 1 and 2:
Annual Report 2011 Relazione interm
- Page 3 and 4:
Statements of Comprehensive Income
- Page 5 and 6:
Letter to the Shareholders To the S
- Page 7 and 8:
Key Operating and Financial Data -
- Page 9 and 10:
The trend of the key operating and
- Page 11 and 12:
Liquidity margin: at December 31, 2
- Page 13 and 14:
Consolidated Operating and Financia
- Page 15 and 16:
Review of Operating and Financial P
- Page 17 and 18:
The fixed-line area, with a contrac
- Page 19 and 20:
- lower expenses of 246 million eur
- Page 21 and 22:
Business Unit (-329 million euros)
- Page 23 and 24:
Income tax expense Income tax expen
- Page 25 and 26:
eflect the definitive fair value of
- Page 27 and 28:
Capital expenditures on an accrual
- Page 29 and 30:
Finance expenses, income taxes and
- Page 31 and 32:
The financial risk management polic
- Page 33 and 34:
On August 3, 2011, a bilateral stan
- Page 35 and 36:
Research and Development As for “
- Page 37 and 38:
Consolidated Financial Statements -
- Page 39 and 40:
Consolidated Statements of Financia
- Page 41 and 42:
Consolidated Statements of Cash Flo
- Page 43 and 44:
Highlights - The Business Units of
- Page 45 and 46:
The Business Units of the Telecom I
- Page 47 and 48:
International Wholesale (millions o
- Page 49 and 50:
compared to the same period of 2010
- Page 51 and 52:
In detail: (millions of euros) 2011
- Page 53 and 54:
Cubomusica GRATIS per 1 anno. Durin
- Page 55 and 56:
In particular, for the unbundling c
- Page 57 and 58:
International roaming On July 6, 20
- Page 59 and 60:
For the telecommunications operator
- Page 61 and 62:
Brazil The Telecom Italia Group ope
- Page 63 and 64:
EBIT EBIT is 2,294 million reais, i
- Page 65 and 66:
Argentina The Telecom Italia Group
- Page 67 and 68:
Mobile telephony service: Telecom P
- Page 69 and 70:
Again with regard to value-added se
- Page 71 and 72:
Revenues Revenues amount to 238 mil
- Page 73 and 74:
Principal changes in the regulatory
- Page 75 and 76:
• it erroneously attributed the m
- Page 77 and 78:
European sales recorded a good tren
- Page 79 and 80:
Review of Operating and Financial P
- Page 81 and 82:
The reduction of 483 million euros
- Page 83 and 84:
(162 million euros, on the basis of
- Page 85 and 86:
Equity Equity amounts to 20,537 mil
- Page 87 and 88:
Dividends flow Dividends paid amoun
- Page 89 and 90:
Bonds Bonds at December 31, 2011 to
- Page 91 and 92:
Financial Statements - Telecom Ital
- Page 93 and 94:
Statements of Financial Position (m
- Page 95 and 96:
Additional Cash Flow Information (m
- Page 97 and 98:
Corporate Boards at December 31, 20
- Page 99 and 100:
Macro-Organization Group at Decembe
- Page 101 and 102:
other sources of information, the p
- Page 103 and 104:
Relative performance by Tim Partici
- Page 105 and 106:
Related Party Transactions In accor
- Page 107 and 108:
the Dow Jones Sustainability World
- Page 109 and 110:
Economic value generated and distri
- Page 111 and 112:
Type of customer care customer Over
- Page 113 and 114:
Involvement initiatives For the fif
- Page 115 and 116:
Vehicles Telecom Italia S.p.A. 2011
- Page 117 and 118:
• cogeneration/trigeneration: 5 l
- Page 119 and 120:
• an increase in emissions attrib
- Page 121 and 122:
channels have been registered as "D
- Page 123 and 124:
• Network and service platform in
- Page 125 and 126:
• E-learning and evolved teaching
- Page 127 and 128:
Tim Brasil Group (units) 12.31.2011
- Page 129 and 130:
Development The 2010 Group performa
- Page 131 and 132:
Internal communication The main act
- Page 133 and 134:
introduced on this subject. The agr
- Page 135 and 136:
On August 2, 2011 the second phase
- Page 137 and 138:
The Risk Management department mana
- Page 139 and 140:
Net financial debt is calculated as
- Page 141 and 142:
Bundle. Commercial offer including
- Page 143 and 144:
HFC (Hydrofluorocarbons). Hydrofluo
- Page 145 and 146:
Shared Access. Methods of shared ac
- Page 147 and 148:
Consolidated Financial Statements a
- Page 149 and 150:
Note 34 - Other income (expenses) f
- Page 151 and 152:
Equity and Liabilities (millions of
- Page 153 and 154:
Consolidated Statements of Comprehe
- Page 155 and 156:
Consolidated Statements of Cash Flo
- Page 157 and 158:
Note 1 - Form, content and other ge
- Page 159 and 160:
• Argentina: includes fixed (Tele
- Page 161 and 162:
Note 2 - Accounting policies Going
- Page 163 and 164:
case of loss of control of a subsid
- Page 165 and 166:
Impairment of intangible and tangib
- Page 167 and 168:
• held to maturity (originally mo
- Page 169 and 170:
Inventories Inventories are measure
- Page 171 and 172:
Revenues are recognized to the exte
- Page 173 and 174:
Use of estimates The preparation of
- Page 175 and 176:
Note 3 - Business combinations Acqu
- Page 177 and 178:
Acquisition of control of Sofora Te
- Page 179 and 180:
Note 4 - Goodwill Goodwill shows th
- Page 181 and 182:
Core Domestic International Wholesa
- Page 183 and 184:
Changes in key variables needed to
- Page 185 and 186:
Concessions, licenses, trademarks a
- Page 187 and 188:
Note 6 - Tangible assets (owned and
- Page 189 and 190:
Gross carrying amount, accumulated
- Page 191 and 192:
Gross carrying amount, accumulated
- Page 193 and 194:
Aggregate data for 2011 and 2010, p
- Page 195 and 196:
Note 9 - Financial assets (non-curr
- Page 197 and 198:
Note 10 - Miscellaneous receivables
- Page 199 and 200:
The temporary differences which mak
- Page 201 and 202:
In addition to this effect, the inc
- Page 203 and 204:
Note 13 - Trade and miscellaneous r
- Page 205 and 206:
Note 14 - Equity Equity includes: (
- Page 207 and 208:
• the reduction of share capital
- Page 209 and 210:
• to mandate the board of directo
- Page 211 and 212:
Gross financial debt according to t
- Page 213 and 214:
The following table lists the bonds
- Page 215 and 216:
Nortel Inversora S.A. Preferred Ser
- Page 217 and 218:
Such obligation, required by nation
- Page 219 and 220:
Revolving Credit Facility The follo
- Page 221 and 222:
Note 17 - Financial risk management
- Page 223 and 224:
of market parameters, even though t
- Page 225 and 226:
In order to limit the risk of the n
- Page 227 and 228:
Note 18 -Derivatives Derivative fin
- Page 229 and 230:
Note 19 - Supplementary disclosures
- Page 231 and 232:
Comparison between carrying amount
- Page 233 and 234:
Carrying amount for each class of f
- Page 235 and 236:
Fair value hierarchy level for each
- Page 237 and 238:
Note 20 - Employee benefits Employe
- Page 239 and 240:
The effect on the income statement,
- Page 241 and 242:
Note 22 - Miscellaneous payables an
- Page 243 and 244:
Note 24 - Contingent liabilities, o
- Page 245 and 246:
On December 16, 2011 Telecom Italia
- Page 247 and 248:
In a judgement on November 2, 2011,
- Page 249 and 250:
Greece -DELAN During 2009, the comp
- Page 251 and 252:
c) Commitments and guarantees Guara
- Page 253 and 254:
Note 27 - Acquisition of goods and
- Page 255 and 256: Note 29 - Other operating expenses
- Page 257 and 258: Note 32 - Gains (losses) on disposa
- Page 259 and 260: Note 34 - Other income (expenses) f
- Page 261 and 262: Finance expenses Finance expenses d
- Page 263 and 264: Note 36 - Profit (loss) for the yea
- Page 265 and 266: Future potential changes in share c
- Page 267 and 268: Note 38 - Segment reporting a) Repo
- Page 269 and 270: Headcount by Operating Segment (num
- Page 271 and 272: The effects on the individual line
- Page 273 and 274: Transactions with associates and jo
- Page 275 and 276: Transactions with companies control
- Page 277 and 278: Transactions with other related par
- Page 279 and 280: (millions of euros) 12/31/2011 12/3
- Page 281 and 282: In the 2011, the contributions paid
- Page 283 and 284: Description of other Telecom Italia
- Page 285 and 286: Calculation of fair value measureme
- Page 287 and 288: Note 41 - Significant non-recurring
- Page 289 and 290: Note 42 - Positions or transactions
- Page 291 and 292: c) Operating leases Revenue related
- Page 293 and 294: Note 44 - Events subsequent to Dece
- Page 295 and 296: Name Head office Currency Share cap
- Page 297 and 298: Name Head office Currency Share cap
- Page 299 and 300: Certification of the Consolidated F
- Page 301 and 302: Consolidated Financial Statements T
- Page 303 and 304: Contents Telecom Italia S.p.A. Sepa
- Page 305: Statements of Financial Position As
- Page 309 and 310: Statements of Changes in Equity Sta
- Page 311 and 312: Additional Cash Flow Information (t
- Page 313 and 314: Profit (loss) before tax from conti
- Page 315 and 316: • the capitalized costs can be me
- Page 317 and 318: Intangible and tangible assets with
- Page 319 and 320: Financial liabilities hedged by der
- Page 321 and 322: Starting from January 1, 2007, Ital
- Page 323 and 324: Finance income and expenses Finance
- Page 325 and 326: • IFRIC 19 (Extinguishing Financi
- Page 327 and 328: The cost of capital used for the es
- Page 329 and 330: Type of license The net carrying am
- Page 331 and 332: Note 5 - Tangible assets (owned and
- Page 333 and 334: 12/31/2010 Accumulated impairment l
- Page 335 and 336: Note 6 - Investments Investments de
- Page 337 and 338: (thousands of euros) Carrying amoun
- Page 339 and 340: 5,620 thousand euros for receivable
- Page 341 and 342: Note 8 - Miscellaneous receivables
- Page 343 and 344: The temporary differences which mak
- Page 345 and 346: Note 10 - Inventories Inventories a
- Page 347 and 348: Trade receivables amount to 4,162,0
- Page 349 and 350: Note 12 - Equity Equity is composed
- Page 351 and 352: Share capital carries a restriction
- Page 353 and 354: The following statement provides ad
- Page 355 and 356: With regard to additional capital i
- Page 357 and 358:
Note 13 - Financial liabilities (no
- Page 359 and 360:
The main components of financial li
- Page 361 and 362:
elating to items classified as curr
- Page 363 and 364:
• the loan contract signed by Tel
- Page 365 and 366:
Note 14 - Net financial debt As req
- Page 367 and 368:
Total Financial liabilities (at the
- Page 369 and 370:
Financial liabilities - Maturities
- Page 371 and 372:
Currency of denomination Notional a
- Page 373 and 374:
Carrying amount for each class of f
- Page 375 and 376:
Fair value hierarchy level for each
- Page 377 and 378:
Comparison between carrying amount
- Page 379 and 380:
Gains and losses by IAS 39 category
- Page 381 and 382:
Under IAS 19, employee severance in
- Page 383 and 384:
Note 19 - Provisions Provisions dec
- Page 385 and 386:
Note 21 - Trade and miscellaneous p
- Page 387 and 388:
Note 22 - Contingent liabilities, o
- Page 389 and 390:
outcome is considered probable. As
- Page 391 and 392:
Federazione Anti Pirateria Audiovis
- Page 393 and 394:
offers, contractual profile changes
- Page 395 and 396:
Note 23 - Revenues Revenues decreas
- Page 397 and 398:
Note 26 - Employee benefits expense
- Page 399 and 400:
Note 30 - Depreciation and amortiza
- Page 401 and 402:
Note 34 - Finance income and Financ
- Page 403 and 404:
Note 35 - Related party transaction
- Page 405 and 406:
STATEMENT OF FINANCIAL POSITION LIN
- Page 407 and 408:
Transactions with subsidiaries The
- Page 409 and 410:
Total income (expenses) from invest
- Page 411 and 412:
(thousands of euros) 12/31/2011 12/
- Page 413 and 414:
STATEMENT OF CASH FLOWS LINE ITEMS
- Page 415 and 416:
STATEMENT OF FINANCIAL POSITION LIN
- Page 417 and 418:
STATEMENT OF FINANCIAL POSITION LIN
- Page 419 and 420:
STATEMENT OF FINANCIAL POSITION LIN
- Page 421 and 422:
Remuneration to key managers In 201
- Page 423 and 424:
The beneficiaries were identified i
- Page 425 and 426:
Parameters used to determine fair v
- Page 427 and 428:
Note 37 - Significant non-recurring
- Page 429 and 430:
Expense related Telecom Italia has
- Page 431 and 432:
Note 41 - List of investments in su
- Page 433 and 434:
Certification of the Separate Finan
- Page 435 and 436:
Telecom Italia S.p.A. Separate Fina
- Page 437 and 438:
Report of the Board of Statutory Au
- Page 439 and 440:
The Board of Auditors has overseen
- Page 441 and 442:
amendments Agreed procedures and de
- Page 443 and 444:
PricewaterhouseCoopers S.p.A. commu
- Page 445 and 446:
On 7 July 2011, after the alignment
- Page 447 and 448:
met the Chairman of the Conselho Fi
- Page 449 and 450:
Regarding the provisions of article
- Page 451 and 452:
18. No significant facts that shoul
- Page 453 and 454:
non-compliances imputable to the ex
- Page 455 and 456:
corporate bodies, and in particular
- Page 457 and 458:
amount equal to 2% of the par value
- Page 459 and 460:
curricula vitae are attached) as Di
- Page 461 and 462:
at least twenty-five days before th
- Page 463 and 464:
Authorization to increase share cap
- Page 465 and 466:
and this is confirmed in a report p
- Page 467 and 468:
5.6 - For five years starting from
- Page 469 and 470:
Proposed Resolution The Shareholder
- Page 471 and 472:
9.8 - In appointing directors who f
- Page 473 and 474:
only one slate. 17.10 - The Board o
- Page 475 and 476:
17.17 - At the first renewal of the