- Page 1 and 2: Annual Report 2011 Relazione interm
- Page 3 and 4: Statements of Comprehensive Income
- Page 5 and 6: Letter to the Shareholders To the S
- Page 7 and 8: Key Operating and Financial Data -
- Page 9 and 10: The trend of the key operating and
- Page 11 and 12: Liquidity margin: at December 31, 2
- Page 13 and 14: Consolidated Operating and Financia
- Page 15 and 16: Review of Operating and Financial P
- Page 17 and 18: The fixed-line area, with a contrac
- Page 19 and 20: - lower expenses of 246 million eur
- Page 21 and 22: Business Unit (-329 million euros)
- Page 23 and 24: Income tax expense Income tax expen
- Page 25 and 26: eflect the definitive fair value of
- Page 27 and 28: Capital expenditures on an accrual
- Page 29 and 30: Finance expenses, income taxes and
- Page 31 and 32: The financial risk management polic
- Page 33 and 34: On August 3, 2011, a bilateral stan
- Page 35 and 36: Research and Development As for “
- Page 37 and 38: Consolidated Financial Statements -
- Page 39 and 40: Consolidated Statements of Financia
- Page 41 and 42: Consolidated Statements of Cash Flo
- Page 43 and 44: Highlights - The Business Units of
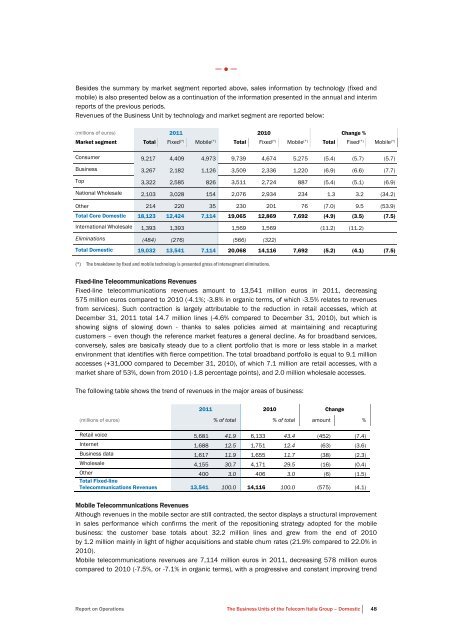
- Page 45 and 46: The Business Units of the Telecom I
- Page 47: International Wholesale (millions o
- Page 51 and 52: In detail: (millions of euros) 2011
- Page 53 and 54: Cubomusica GRATIS per 1 anno. Durin
- Page 55 and 56: In particular, for the unbundling c
- Page 57 and 58: International roaming On July 6, 20
- Page 59 and 60: For the telecommunications operator
- Page 61 and 62: Brazil The Telecom Italia Group ope
- Page 63 and 64: EBIT EBIT is 2,294 million reais, i
- Page 65 and 66: Argentina The Telecom Italia Group
- Page 67 and 68: Mobile telephony service: Telecom P
- Page 69 and 70: Again with regard to value-added se
- Page 71 and 72: Revenues Revenues amount to 238 mil
- Page 73 and 74: Principal changes in the regulatory
- Page 75 and 76: • it erroneously attributed the m
- Page 77 and 78: European sales recorded a good tren
- Page 79 and 80: Review of Operating and Financial P
- Page 81 and 82: The reduction of 483 million euros
- Page 83 and 84: (162 million euros, on the basis of
- Page 85 and 86: Equity Equity amounts to 20,537 mil
- Page 87 and 88: Dividends flow Dividends paid amoun
- Page 89 and 90: Bonds Bonds at December 31, 2011 to
- Page 91 and 92: Financial Statements - Telecom Ital
- Page 93 and 94: Statements of Financial Position (m
- Page 95 and 96: Additional Cash Flow Information (m
- Page 97 and 98: Corporate Boards at December 31, 20
- Page 99 and 100:
Macro-Organization Group at Decembe
- Page 101 and 102:
other sources of information, the p
- Page 103 and 104:
Relative performance by Tim Partici
- Page 105 and 106:
Related Party Transactions In accor
- Page 107 and 108:
the Dow Jones Sustainability World
- Page 109 and 110:
Economic value generated and distri
- Page 111 and 112:
Type of customer care customer Over
- Page 113 and 114:
Involvement initiatives For the fif
- Page 115 and 116:
Vehicles Telecom Italia S.p.A. 2011
- Page 117 and 118:
• cogeneration/trigeneration: 5 l
- Page 119 and 120:
• an increase in emissions attrib
- Page 121 and 122:
channels have been registered as "D
- Page 123 and 124:
• Network and service platform in
- Page 125 and 126:
• E-learning and evolved teaching
- Page 127 and 128:
Tim Brasil Group (units) 12.31.2011
- Page 129 and 130:
Development The 2010 Group performa
- Page 131 and 132:
Internal communication The main act
- Page 133 and 134:
introduced on this subject. The agr
- Page 135 and 136:
On August 2, 2011 the second phase
- Page 137 and 138:
The Risk Management department mana
- Page 139 and 140:
Net financial debt is calculated as
- Page 141 and 142:
Bundle. Commercial offer including
- Page 143 and 144:
HFC (Hydrofluorocarbons). Hydrofluo
- Page 145 and 146:
Shared Access. Methods of shared ac
- Page 147 and 148:
Consolidated Financial Statements a
- Page 149 and 150:
Note 34 - Other income (expenses) f
- Page 151 and 152:
Equity and Liabilities (millions of
- Page 153 and 154:
Consolidated Statements of Comprehe
- Page 155 and 156:
Consolidated Statements of Cash Flo
- Page 157 and 158:
Note 1 - Form, content and other ge
- Page 159 and 160:
• Argentina: includes fixed (Tele
- Page 161 and 162:
Note 2 - Accounting policies Going
- Page 163 and 164:
case of loss of control of a subsid
- Page 165 and 166:
Impairment of intangible and tangib
- Page 167 and 168:
• held to maturity (originally mo
- Page 169 and 170:
Inventories Inventories are measure
- Page 171 and 172:
Revenues are recognized to the exte
- Page 173 and 174:
Use of estimates The preparation of
- Page 175 and 176:
Note 3 - Business combinations Acqu
- Page 177 and 178:
Acquisition of control of Sofora Te
- Page 179 and 180:
Note 4 - Goodwill Goodwill shows th
- Page 181 and 182:
Core Domestic International Wholesa
- Page 183 and 184:
Changes in key variables needed to
- Page 185 and 186:
Concessions, licenses, trademarks a
- Page 187 and 188:
Note 6 - Tangible assets (owned and
- Page 189 and 190:
Gross carrying amount, accumulated
- Page 191 and 192:
Gross carrying amount, accumulated
- Page 193 and 194:
Aggregate data for 2011 and 2010, p
- Page 195 and 196:
Note 9 - Financial assets (non-curr
- Page 197 and 198:
Note 10 - Miscellaneous receivables
- Page 199 and 200:
The temporary differences which mak
- Page 201 and 202:
In addition to this effect, the inc
- Page 203 and 204:
Note 13 - Trade and miscellaneous r
- Page 205 and 206:
Note 14 - Equity Equity includes: (
- Page 207 and 208:
• the reduction of share capital
- Page 209 and 210:
• to mandate the board of directo
- Page 211 and 212:
Gross financial debt according to t
- Page 213 and 214:
The following table lists the bonds
- Page 215 and 216:
Nortel Inversora S.A. Preferred Ser
- Page 217 and 218:
Such obligation, required by nation
- Page 219 and 220:
Revolving Credit Facility The follo
- Page 221 and 222:
Note 17 - Financial risk management
- Page 223 and 224:
of market parameters, even though t
- Page 225 and 226:
In order to limit the risk of the n
- Page 227 and 228:
Note 18 -Derivatives Derivative fin
- Page 229 and 230:
Note 19 - Supplementary disclosures
- Page 231 and 232:
Comparison between carrying amount
- Page 233 and 234:
Carrying amount for each class of f
- Page 235 and 236:
Fair value hierarchy level for each
- Page 237 and 238:
Note 20 - Employee benefits Employe
- Page 239 and 240:
The effect on the income statement,
- Page 241 and 242:
Note 22 - Miscellaneous payables an
- Page 243 and 244:
Note 24 - Contingent liabilities, o
- Page 245 and 246:
On December 16, 2011 Telecom Italia
- Page 247 and 248:
In a judgement on November 2, 2011,
- Page 249 and 250:
Greece -DELAN During 2009, the comp
- Page 251 and 252:
c) Commitments and guarantees Guara
- Page 253 and 254:
Note 27 - Acquisition of goods and
- Page 255 and 256:
Note 29 - Other operating expenses
- Page 257 and 258:
Note 32 - Gains (losses) on disposa
- Page 259 and 260:
Note 34 - Other income (expenses) f
- Page 261 and 262:
Finance expenses Finance expenses d
- Page 263 and 264:
Note 36 - Profit (loss) for the yea
- Page 265 and 266:
Future potential changes in share c
- Page 267 and 268:
Note 38 - Segment reporting a) Repo
- Page 269 and 270:
Headcount by Operating Segment (num
- Page 271 and 272:
The effects on the individual line
- Page 273 and 274:
Transactions with associates and jo
- Page 275 and 276:
Transactions with companies control
- Page 277 and 278:
Transactions with other related par
- Page 279 and 280:
(millions of euros) 12/31/2011 12/3
- Page 281 and 282:
In the 2011, the contributions paid
- Page 283 and 284:
Description of other Telecom Italia
- Page 285 and 286:
Calculation of fair value measureme
- Page 287 and 288:
Note 41 - Significant non-recurring
- Page 289 and 290:
Note 42 - Positions or transactions
- Page 291 and 292:
c) Operating leases Revenue related
- Page 293 and 294:
Note 44 - Events subsequent to Dece
- Page 295 and 296:
Name Head office Currency Share cap
- Page 297 and 298:
Name Head office Currency Share cap
- Page 299 and 300:
Certification of the Consolidated F
- Page 301 and 302:
Consolidated Financial Statements T
- Page 303 and 304:
Contents Telecom Italia S.p.A. Sepa
- Page 305 and 306:
Statements of Financial Position As
- Page 307 and 308:
Separate Income Statements (euros)
- Page 309 and 310:
Statements of Changes in Equity Sta
- Page 311 and 312:
Additional Cash Flow Information (t
- Page 313 and 314:
Profit (loss) before tax from conti
- Page 315 and 316:
• the capitalized costs can be me
- Page 317 and 318:
Intangible and tangible assets with
- Page 319 and 320:
Financial liabilities hedged by der
- Page 321 and 322:
Starting from January 1, 2007, Ital
- Page 323 and 324:
Finance income and expenses Finance
- Page 325 and 326:
• IFRIC 19 (Extinguishing Financi
- Page 327 and 328:
The cost of capital used for the es
- Page 329 and 330:
Type of license The net carrying am
- Page 331 and 332:
Note 5 - Tangible assets (owned and
- Page 333 and 334:
12/31/2010 Accumulated impairment l
- Page 335 and 336:
Note 6 - Investments Investments de
- Page 337 and 338:
(thousands of euros) Carrying amoun
- Page 339 and 340:
5,620 thousand euros for receivable
- Page 341 and 342:
Note 8 - Miscellaneous receivables
- Page 343 and 344:
The temporary differences which mak
- Page 345 and 346:
Note 10 - Inventories Inventories a
- Page 347 and 348:
Trade receivables amount to 4,162,0
- Page 349 and 350:
Note 12 - Equity Equity is composed
- Page 351 and 352:
Share capital carries a restriction
- Page 353 and 354:
The following statement provides ad
- Page 355 and 356:
With regard to additional capital i
- Page 357 and 358:
Note 13 - Financial liabilities (no
- Page 359 and 360:
The main components of financial li
- Page 361 and 362:
elating to items classified as curr
- Page 363 and 364:
• the loan contract signed by Tel
- Page 365 and 366:
Note 14 - Net financial debt As req
- Page 367 and 368:
Total Financial liabilities (at the
- Page 369 and 370:
Financial liabilities - Maturities
- Page 371 and 372:
Currency of denomination Notional a
- Page 373 and 374:
Carrying amount for each class of f
- Page 375 and 376:
Fair value hierarchy level for each
- Page 377 and 378:
Comparison between carrying amount
- Page 379 and 380:
Gains and losses by IAS 39 category
- Page 381 and 382:
Under IAS 19, employee severance in
- Page 383 and 384:
Note 19 - Provisions Provisions dec
- Page 385 and 386:
Note 21 - Trade and miscellaneous p
- Page 387 and 388:
Note 22 - Contingent liabilities, o
- Page 389 and 390:
outcome is considered probable. As
- Page 391 and 392:
Federazione Anti Pirateria Audiovis
- Page 393 and 394:
offers, contractual profile changes
- Page 395 and 396:
Note 23 - Revenues Revenues decreas
- Page 397 and 398:
Note 26 - Employee benefits expense
- Page 399 and 400:
Note 30 - Depreciation and amortiza
- Page 401 and 402:
Note 34 - Finance income and Financ
- Page 403 and 404:
Note 35 - Related party transaction
- Page 405 and 406:
STATEMENT OF FINANCIAL POSITION LIN
- Page 407 and 408:
Transactions with subsidiaries The
- Page 409 and 410:
Total income (expenses) from invest
- Page 411 and 412:
(thousands of euros) 12/31/2011 12/
- Page 413 and 414:
STATEMENT OF CASH FLOWS LINE ITEMS
- Page 415 and 416:
STATEMENT OF FINANCIAL POSITION LIN
- Page 417 and 418:
STATEMENT OF FINANCIAL POSITION LIN
- Page 419 and 420:
STATEMENT OF FINANCIAL POSITION LIN
- Page 421 and 422:
Remuneration to key managers In 201
- Page 423 and 424:
The beneficiaries were identified i
- Page 425 and 426:
Parameters used to determine fair v
- Page 427 and 428:
Note 37 - Significant non-recurring
- Page 429 and 430:
Expense related Telecom Italia has
- Page 431 and 432:
Note 41 - List of investments in su
- Page 433 and 434:
Certification of the Separate Finan
- Page 435 and 436:
Telecom Italia S.p.A. Separate Fina
- Page 437 and 438:
Report of the Board of Statutory Au
- Page 439 and 440:
The Board of Auditors has overseen
- Page 441 and 442:
amendments Agreed procedures and de
- Page 443 and 444:
PricewaterhouseCoopers S.p.A. commu
- Page 445 and 446:
On 7 July 2011, after the alignment
- Page 447 and 448:
met the Chairman of the Conselho Fi
- Page 449 and 450:
Regarding the provisions of article
- Page 451 and 452:
18. No significant facts that shoul
- Page 453 and 454:
non-compliances imputable to the ex
- Page 455 and 456:
corporate bodies, and in particular
- Page 457 and 458:
amount equal to 2% of the par value
- Page 459 and 460:
curricula vitae are attached) as Di
- Page 461 and 462:
at least twenty-five days before th
- Page 463 and 464:
Authorization to increase share cap
- Page 465 and 466:
and this is confirmed in a report p
- Page 467 and 468:
5.6 - For five years starting from
- Page 469 and 470:
Proposed Resolution The Shareholder
- Page 471 and 472:
9.8 - In appointing directors who f
- Page 473 and 474:
only one slate. 17.10 - The Board o
- Page 475 and 476:
17.17 - At the first renewal of the