- Page 1 and 2:
Boreskov Institute of Catalysisof t
- Page 3 and 4:
INTERNATIONAL SCIENTIFIC COMMITTEEV
- Page 5 and 6:
SILVER SPONSORThe organizers expres
- Page 7 and 8:
PL-1HOW TO DESIGN OPTIMAL CATALYTIC
- Page 9 and 10:
MULTIFUNCTIONAL DEVICES FOR INTENSI
- Page 11 and 12:
PL-3DESIGN OF CATALYTIC PROCESSES F
- Page 13 and 14:
PL-3Indeed preparation and testing
- Page 15 and 16:
PL-4The second part of the lecture
- Page 17 and 18:
PL-5Reactor designs with intensifie
- Page 19 and 20:
PL-6MEMBRANE REACTORS: STATE OF THE
- Page 21 and 22:
KEY-NOTE PRESENTATIONS
- Page 23 and 24:
KN-1description, that can be charac
- Page 25 and 26:
KN-2selective catalytic reduction o
- Page 27 and 28:
KN-3Fig. 1. Experimental burner of
- Page 29 and 30:
KN-4~200°C. This is based on the H
- Page 31 and 32:
KN-5for addressing the quality of t
- Page 33 and 34:
KN-6reaction with ethanol and the b
- Page 35 and 36:
KN-7at temperature lower than 873K,
- Page 37 and 38:
REACTION KINETICS AND REACTION ENHA
- Page 39 and 40:
OP-I-2RELATION BETWEEN THE ACTIVATI
- Page 41 and 42:
COMPARISON OF CHEMICAL AND ENZYMATI
- Page 43 and 44:
OP-I-4NONLINEAR PHENOMENA DURING ME
- Page 45 and 46:
OP-I-5SPECIFICITY OF THE OSCILLATIO
- Page 47 and 48:
OP-I-6TRENDS IN BISTABILITY DOMAINS
- Page 49 and 50:
OP-I-7NON-STEADY-STATE CATALYST CHA
- Page 51 and 52:
OP-I-8TRANSIENT KINETIC STUDIES OF
- Page 53 and 54:
OP-I-9A REDOX KINETICS FOR THE PART
- Page 55 and 56:
OP-I-9500Flow of Air = 0.3 m 3 (STP
- Page 57 and 58:
OP-I-11ELUCIDATION OF THE REACTIVIT
- Page 59 and 60:
KINETIC MODELLING OF THE JOINT TRAN
- Page 61 and 62:
OP-I-13n-HEXANE SKELETAL ISOMERIZAT
- Page 63 and 64:
OP-I-14the slow branch of kinetic c
- Page 65 and 66:
OP-I-15The hydride palladium comple
- Page 67 and 68:
Energy Conservation (field j)∂∂
- Page 69 and 70:
OP-I-17Selectivity (mol. %)10099989
- Page 71 and 72:
OP-I-18According to GLC the main pr
- Page 73 and 74:
OP-I-19and slug dimensions, formati
- Page 75 and 76:
OP-I-20A RANS volume of fluids [1]
- Page 77 and 78:
OP-I-21the physical-chemical charac
- Page 79 and 80:
OP-I-22calculated values of pressur
- Page 81 and 82:
OP-I-23where L c - capillary length
- Page 83 and 84:
OP-I-24and diffuse transmission thr
- Page 85 and 86:
OP-I-25effect of bubble break-up wo
- Page 87 and 88:
OP-I-26strong influence on the soli
- Page 89 and 90:
OP-I-27wHCOOH=1+K2K1(1 + K3⋅ P⋅
- Page 91 and 92:
OP-I-28dimensional profiles detecte
- Page 93 and 94:
OP-I-29results. The results of the
- Page 95 and 96:
OP-I-30Fig. 1. Hydrodynamics and co
- Page 97 and 98:
OP-I-31Convection and diffusion wit
- Page 99 and 100:
TEMPERATURE RISE DURING REGENERATIO
- Page 101 and 102:
OP-II-2[4]. Similar temperature pro
- Page 103 and 104:
OP-II-3(Fig, 1 a, b) upon testing i
- Page 105 and 106:
OP-II-4In the second step optimizat
- Page 107 and 108:
OP-II-5membrane contactors were stu
- Page 109 and 110:
OP-II-6reaction over Cu/CeO 2-x cat
- Page 111 and 112:
OP-II-7is modelled by means of a tw
- Page 113 and 114:
OP-II-8the reactor [6]. However, th
- Page 115 and 116:
OP-II-9Figure 1. Computed volume fr
- Page 117 and 118:
OP-II-10assumes variables’ distri
- Page 119 and 120:
OP-II-11oxide support, it comes tha
- Page 121 and 122:
OP-II-12was connected to G.C. via s
- Page 123 and 124:
OP-II-13catalyst bed was 6 mm. Thre
- Page 125 and 126:
OP-II-14as coolant is an important
- Page 127 and 128:
OP-II-15Flow (L/h)7654321Bottoms ra
- Page 129 and 130:
OP-II-16(4) The gas recirculation r
- Page 131 and 132:
OP-II-17Catalytic reactions were ca
- Page 133 and 134:
OP-II-18At steady surface coverage
- Page 135 and 136:
OP-II-19gaimpulsegeneratorwateFig.
- Page 137 and 138:
OP-II-20examined (see Figure 1). Th
- Page 139 and 140:
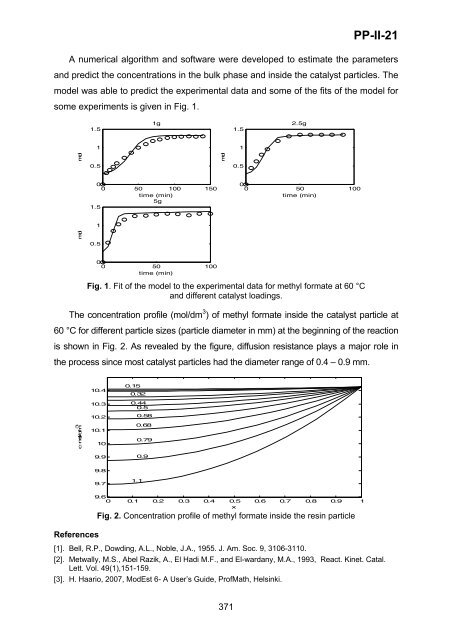
OP-II-21References[1]. M.P. Dudukov
- Page 141 and 142:
OP-II-22of the hydrogen oxidation a
- Page 143 and 144:
OP-II-23TemperaturesensorsThe efflu
- Page 145 and 146:
OP-II-24of reactant conversions. Pa
- Page 147 and 148:
OP-II-25(surface) ‘wall-reaction
- Page 149 and 150:
OP-II-26It was found that the 10 wt
- Page 151 and 152:
OP-II-27non-flow type. During the M
- Page 153 and 154:
OP-III-A-1A NEW SIMPLE MICROCHANNEL
- Page 155 and 156:
BUBBLING FLUIDISED BED PYROLYSIS OF
- Page 157 and 158:
PINEWOOD PYROLYSIS UNDER VACUUM CON
- Page 159 and 160:
OP-III-A-5PYROLYSIS OF HDPE IN A CO
- Page 161 and 162:
OP-III-A-6REACTORS FOR THE GREEN TR
- Page 163 and 164:
DEHYDRATION OF GLYCEROL TO ACROLEIN
- Page 165 and 166:
OP-III-A-8LACTIC ACID BASED ON BIO
- Page 167 and 168:
RECOVERY OF ACETIC ACID FROM PYROLY
- Page 169 and 170:
OP-III-A-10LIPASE-CATALYZED REACTIO
- Page 171 and 172:
OP-III-A-11INVESTIGATION ON THERMOC
- Page 173 and 174:
OP-III-A-12SELECTIVE CATALYTIC DEOX
- Page 175 and 176:
ETHANOL STEAM REFORMING OVER COBALT
- Page 177 and 178:
OP-III-A-14HYDROTREATMENT CATALYSTS
- Page 179 and 180:
ORAL PRESENTATIONSSECTION IIIChemic
- Page 181 and 182:
OP-III-B-1Reactor parameters:Intern
- Page 183 and 184:
OP-III-B-2JOINT STEAM REFORMING OF
- Page 185 and 186:
OP-III-B-3LANDFILL BIOGAS PURIFICAT
- Page 187 and 188:
OP-III-B-4MODELING AND SIMULATION O
- Page 189 and 190:
OP-III-B-5DemonstratorThe medium-te
- Page 191 and 192:
OP-III-B-630/19.6 Nl/min (space vel
- Page 193 and 194:
OP-III-B-7mixed in the ratios: 94,8
- Page 195 and 196:
OP-III-B-8Table 1.Material balance
- Page 197 and 198:
OP-III-B-9Based on the results of t
- Page 199 and 200:
OP-III-B-10On this basis it can be
- Page 201 and 202:
OP-III-B-11Similar trends caused by
- Page 203 and 204:
OP-III-B-12(mol/s g cat)x108r4,6-DM
- Page 205 and 206:
OP-III-B-13carbon in Wyoming coal i
- Page 207 and 208:
OP-III-B-14MODELING PRODUCT DISTRIB
- Page 209 and 210:
OP-III-B-15COMBINED TECHNOLOGY OF U
- Page 211 and 212:
MATEMATICAL MODEL FOR DOWNDRAFT BIO
- Page 213 and 214:
OP-III-B-17CATALYTIC DEHYDRATION OF
- Page 215 and 216:
OP-III-B-18SYNGAS AND HYDROGEN PROD
- Page 217 and 218:
POSTER PRESENTATIONSSECTION I
- Page 219 and 220:
PP-I-1influence of the direction of
- Page 221 and 222:
PP-I-2At the agitation of the liqui
- Page 223 and 224:
PP-I-3NOLINEAR PHENOMENA IN CATALYT
- Page 225 and 226:
PP-I-4A NEW APPROACH TO KINETIC STU
- Page 227 and 228:
PP-I-5KINETICS OF PROX REACTION OVE
- Page 229 and 230:
PP-I-6PHENOMENA OF SUPERADIABATIC T
- Page 231 and 232:
ELECTROMAGNETIC REACTOR OF WATER TR
- Page 233 and 234:
PP-I-8DIRECT SYNTHESIS OF HYDROGEN
- Page 235 and 236:
PP-I-9DYNAMICS OF FIRST-ORDER PHASE
- Page 237 and 238:
PP-I-10ELECTROCHEMICAL OXIDATION OF
- Page 239 and 240:
PP-I-11CHEMPAK SOFTWARE PACKAGE: OP
- Page 241 and 242:
PP-I-12COMPUTER SIMULATION OF ENDOT
- Page 243 and 244:
PP-I-13MODELLING KINETICS OF PROCES
- Page 245 and 246:
PP-I-14THE INVESTIGATION OF REACTIO
- Page 247 and 248:
PP-I-15The qualitative picture of s
- Page 249 and 250:
Thus, knowing the composition of ra
- Page 251 and 252:
PP-I-17current density. Preliminary
- Page 253 and 254:
PP-I-18Hydrogenation kinetics was d
- Page 255 and 256:
PP-I-19the active mixing, amplitude
- Page 257 and 258:
PP-I-20where r, h indicate the radi
- Page 259 and 260:
PP-I-21model is very anisotropic be
- Page 261 and 262:
PP-I-22- Reduction of the number of
- Page 263 and 264:
PP-I-23oscillations of intermediate
- Page 265 and 266:
PP-I-25SYNTHESIS OF ETHYLENE OXIDE
- Page 267 and 268:
PP-I-26OPTIMUM KINETICS FOR POLYSTY
- Page 269 and 270:
PP-I-27TableSpecific surface area (
- Page 271 and 272:
PP-I-28γ-preirradiated sample), th
- Page 273 and 274:
PP-I-29commercial CFD solver FLUENT
- Page 275 and 276:
PP-I-30modulus, a considerable decr
- Page 277 and 278:
PP-I-31The destruction ways of CF 3
- Page 279 and 280:
PP-I-32[7]. Karoor S, Sirkar K. Gas
- Page 281 and 282:
PP-I-33above 750°. The catalytic p
- Page 283 and 284:
PP-I-35REVERSE FLOW REACTOR WITH FO
- Page 285 and 286:
FLOW-RECIRCULATION METHOD FOR INVES
- Page 287 and 288:
TO A PROBLEM OF OPTIMIZATION OF FUN
- Page 289 and 290:
PP-I-38THE INFLUENCE OF REACTION MI
- Page 291 and 292:
PP-I-39METHANOL OXIDATIVE STEAM REF
- Page 293 and 294:
PP-I-41CORRECT INVESTIGATION OF THE
- Page 295 and 296:
PP-I-42NEW APPROACH OF DEFINITION O
- Page 297 and 298:
PP-I-43STREAM HEAT EXCHANGE OF AERO
- Page 299 and 300:
PP-I-44HIGH TEMPERATURE OXYGEN TRAN
- Page 301 and 302:
PP-I-45KINETICS OF TRANSESTERIFICAT
- Page 303 and 304:
MATHEMATICAL MODELING AND OPTIMIZAT
- Page 305 and 306:
PP-I-47The basic side reaction is r
- Page 307 and 308:
PP-I-49EXPERIMENTAL STUDY OF THE HA
- Page 309 and 310:
PP-I-51ON THE KINETICS AND REGULARI
- Page 311 and 312:
PP-I-52DIFFERENTIAL THERMAL ANALYSI
- Page 313 and 314:
PP-I-53oxidation reaction demonstra
- Page 315 and 316:
PP-I-54of reaction. It is establish
- Page 317 and 318:
PP-I-55effects, are energetically c
- Page 319 and 320: PP-I-56The experiments and simulati
- Page 321 and 322: PP-I-57In the studied range of temp
- Page 323 and 324: PP-I-58HeadingsAdvances in Chemical
- Page 325 and 326: PP-I-59calculated. During the aroma
- Page 327 and 328: PP-I-60with honeycomb catalyst) act
- Page 329 and 330: Т - temperature, K, D eff - effect
- Page 331 and 332: PP-I-62stirring rate were adopted u
- Page 333 and 334: PP-I-63m 2 = (k 1 y 0 1 +k -1 +k 1
- Page 335 and 336: POSTER PRESENTATIONSSECTION II
- Page 337 and 338: PP-II-1values of operating paramete
- Page 339 and 340: ⎡⎛⎢⎜bF⎣⎝=2ab ⎞ 6+ ⎟
- Page 341 and 342: PP-II-4HONEYCOMB MONOLITHIC CATALYS
- Page 343 and 344: MATHEMATICAL MODELING OF THE ALUMIN
- Page 345 and 346: PP-II-6MODELING OF VINYL ACETATE SY
- Page 347 and 348: PP-II-7СENTRIFUGAL DISK REACTORAvv
- Page 349 and 350: PP-II-83) An opportunity of operati
- Page 351 and 352: PP-II-10UV-ACTIVATION OF METHANE CO
- Page 353 and 354: PP-II-11COMBINED APPROACH (FMEA- HA
- Page 355 and 356: PP-II-12Testing the pilot variant o
- Page 357 and 358: PP-II-14NOVEL MICROREACTOR FOR THE
- Page 359 and 360: PP-II-15of 1-2.5 lead to a decreasi
- Page 361 and 362: PP-II-16stages. Kinetic parameters
- Page 363 and 364: PP-II-17whiskers, which assure an a
- Page 365 and 366: PP-II-18с m , с cat - density of
- Page 367 and 368: PP-II-19decrease. So, the potential
- Page 369: PP-II-20products became a mixture o
- Page 373 and 374: PP-II-22motions at any external con
- Page 375 and 376: PP-II-23One of the main technologic
- Page 377 and 378: PP-II-24100 m x 250 μm x 0.5 μm,
- Page 379 and 380: PP-II-25A model was developed to ca
- Page 381 and 382: PP-II-26The results of calculations
- Page 383 and 384: PP-II-27modes of reaction and two d
- Page 385 and 386: PP-II-29OZONE-DESTRUCTION REACTOR B
- Page 387 and 388: PP-II-30Fig. 1. Axial profile of me
- Page 389 and 390: PP-II-31isobutylene in butene fract
- Page 391 and 392: PP-II-322.5x10 -3 ( i )2.5x10 -3 (
- Page 393 and 394: PP-II-33No olefinreadsorptionWith o
- Page 395 and 396: PP-II-34using titania or Ag-doped t
- Page 397 and 398: PP-II-35accidents, is condition dep
- Page 399 and 400: PP-II-36be seen that at temperature
- Page 401 and 402: PP-II-37the solid phase solute conc
- Page 403 and 404: PP-II-38As shown in Table 1, the ca
- Page 405 and 406: PP-II-39better to the obtained in t
- Page 407 and 408: PP-II-40Hydrodynamic regime in the
- Page 409 and 410: PP-II-41activity, relative unit1,21
- Page 411 and 412: PP-II-42One of the major indicators
- Page 413 and 414: PP-II-43These conditions are confor
- Page 415 and 416: PP-II-44For the hepten, alpha-methy
- Page 417 and 418: PP-II-46PARTIAL OXIDATION OF METHAN
- Page 419 and 420: PP-II-47DEVELOPMENT OF VORTEX APPAR
- Page 421 and 422:
MODELING OF CFTALYTIC α-OLEFINS OL
- Page 423 and 424:
PP-II-49Hinselwood kinetic equation
- Page 425 and 426:
3) iterate concentrations at a cut
- Page 427 and 428:
PP-II-51data such flow sheet provid
- Page 429 and 430:
PP-II-53ON THE TECNOLOGY OF TECHNIC
- Page 431 and 432:
PP-II-54PROPYLENE POLYMERIZATION AN
- Page 433 and 434:
REACTOR FOR LIQUID-PHASE PROCESSES
- Page 435 and 436:
PP-II-56MODELING OF CATALYTIC MICRO
- Page 437 and 438:
PP-II-57MATHEMATICAL MODELING OF BE
- Page 439 and 440:
PP-II-58HONEYCOMB CATALYSTS WITH PO
- Page 441 and 442:
POSTER PRESENTATIONSSECTION IIISECT
- Page 443 and 444:
ReferencesPP-III-1[1]. A.N. Pestrya
- Page 445 and 446:
PP-III-2Table1. Percentages of diff
- Page 447 and 448:
PP-III-3conversion for the reaction
- Page 449 and 450:
PP-III-4900Reformer temperature (K)
- Page 451 and 452:
PP-III-5Catalytic performance of th
- Page 453 and 454:
PP-III-6optimization permit better
- Page 455 and 456:
PP-III-8DE-NO X SYSTEM BASED ON H 2
- Page 457 and 458:
PP-III-9SEPARATION BETWEEN CHLORIDE
- Page 459 and 460:
CONVERSION OF WASTE COTTON TO BIOET
- Page 461 and 462:
PP-III-12THE METHOD OF GLYCERIC ACI
- Page 463 and 464:
NOx conversion vs. temperature is p
- Page 465 and 466:
PP-III-14intermetallic diffusion at
- Page 467 and 468:
PP-III-15The conversion of O 2 was
- Page 469 and 470:
PP-III-16H 2consumpition (a.u)(a)39
- Page 471 and 472:
PP-III-17the characteristic structu
- Page 473 and 474:
PP-III-18Figure 1. Influence of tem
- Page 475 and 476:
PP-III-19(a)(b)CH 4conversion, %100
- Page 477 and 478:
PP-III-20take into account own size
- Page 479 and 480:
PP-III-2110080CS-18CS-34CHZ30CHZ801
- Page 481 and 482:
EXPERIMENTALPP-III-22We synthesized
- Page 483 and 484:
PP-III-23Base composition component
- Page 485 and 486:
PP-III-25CO REMOVAL AT THE MICROSCA
- Page 487 and 488:
HYDROGEN PRODUCTION FROM METHANOL U
- Page 489 and 490:
PP-III-27NON CATALITIC PRODUCTION O
- Page 491 and 492:
PP-III-28Different reaction conditi
- Page 493 and 494:
PP-III-29followed by WGS reaction.
- Page 495 and 496:
PP-III-30As a solvent-coreactants w
- Page 497 and 498:
PP-III-31It was concluded that on t
- Page 499 and 500:
PP-III-32Hydrogenolysis of glycerol
- Page 501 and 502:
PP-III-331,6W 0, μmol Н 2/min1,20
- Page 503 and 504:
PP-III-34preparation (glass fiber f
- Page 505 and 506:
PP-III-35In the modification proces
- Page 507 and 508:
PP-III-36The kinetics of acid hydro
- Page 509 and 510:
PP-III-37reaction: i) C=O double bo
- Page 511 and 512:
PP-III-38methane and carbon monoxid
- Page 513 and 514:
PP-III-39from 25 to 60, which was d
- Page 515 and 516:
PP-III-401% w/w for Pd with respect
- Page 517 and 518:
PP-III-41material. Besides, the mol
- Page 519 and 520:
PP-III-43METHANOL AND DIMETHYL ETHE
- Page 521 and 522:
PP-III-44goal is attained by using
- Page 523 and 524:
OLIGOMERISATION OF TERTIARY AMINE L
- Page 525 and 526:
PP-III-47meter (Shimazu Co.; TOC-50
- Page 527 and 528:
PP-III-48the range of 29-87 kJ/mol
- Page 529 and 530:
PP-III-49determine the optimal type
- Page 531 and 532:
PP-III-50NEW CONCEPT FOR A SELF CLE
- Page 533 and 534:
PP-III-51HYDROGEN PRODUCTION BY MET
- Page 535 and 536:
PP-III-52CATALYTIC UPGRADING OF PRO
- Page 537 and 538:
PP-III-53CATALYTIC CONVERSION OF FI
- Page 539 and 540:
PROCESS FOR THE PRODUCTION OF BUTYL
- Page 541 and 542:
PP-III-55been previously fixed and
- Page 543 and 544:
PP-III-56The influence of reaction
- Page 545 and 546:
PP-III-57sample does not contain so
- Page 547 and 548:
PP-III-58The re-activation of the e
- Page 549 and 550:
PP-III-59The aim of this work is th
- Page 551 and 552:
PP-III-61BIODIESEL FROM MICROALGAE
- Page 553 and 554:
DEVELOPING MICROFLUIDIC DEVICE WITH
- Page 555 and 556:
THREE-PHASE DIRECT OILS HYDROGENATI
- Page 557 and 558:
Co-BASED CATALYSTS FOR THE HYDROLYS
- Page 559 and 560:
PP-III-65KINETIC STUDY OF THE CATAL
- Page 561 and 562:
PP-III-66PRODUCTION OF HYDROGEN AND
- Page 563 and 564:
PP-III-67ENHANCED GASIFICATION OF P
- Page 565 and 566:
PP-III-68INFLUENCE OF SPILLOVER ON
- Page 567 and 568:
PP-III-69AEROBIC OXIDATIVE COUPLING
- Page 569 and 570:
PP-III-70MECHANISMS FOR CHEMICAL RE
- Page 571 and 572:
PP-III-70SBS molecules and increase
- Page 573 and 574:
PP-III-71and as a resut, could enha
- Page 575 and 576:
PP-III-72conversion). Al 2 O 3 /PSS
- Page 577 and 578:
PP-III-73SBA50TiSBA% Transmittance5
- Page 579 and 580:
PP-III-74stove heating. Another par
- Page 581 and 582:
PP-III-75TG [%]0-10-20-30380°C400
- Page 583 and 584:
PP-III-76The elementary version of
- Page 585 and 586:
PP-III-77thermodynamically enhanced
- Page 587 and 588:
PP-III-78GFC textileStructuringmeta
- Page 589 and 590:
PP-III-79All the prepared spinel-ox
- Page 591 and 592:
PP-III-80Our new process is polluti
- Page 593 and 594:
PP-III-81Fig. 1. Scheme of the biog
- Page 595 and 596:
PP-III-82Pic. 1 Pic. 2Pic. 1. Schem
- Page 597 and 598:
ARKHIPOV Vladimir AfanasievichResea
- Page 599 and 600:
CENTENO Felipe OrlandoNúcleo de Ex
- Page 601 and 602:
FLID Mark RafailovichScientific Res
- Page 603 and 604:
HOSEN Mohammad AnwarUniversity of M
- Page 605 and 606:
KOZLOVA EkaterinaBoreskov Institute
- Page 607 and 608:
MAKARSHIN Lev LvovichBoreskov Insti
- Page 609 and 610:
ONSAN Zeynep IlsenDepartment of Che
- Page 611 and 612:
REBOLLAR MoisesInstituto De Investi
- Page 613 and 614:
SHEIKH Munir AhmedTraining and Staf
- Page 615 and 616:
SULMAN Esfir MikhailovnaTver Techni
- Page 617 and 618:
ZHAPBASBYEV Uzak KairbekovichKazakh
- Page 619 and 620:
OP-I-3 Pécar D., Gorsek A.COMPARIS
- Page 621 and 622:
OP-II-3Kucherov A.V., Finashina E.D
- Page 623 and 624:
OP-III-A-9 Rasrendra C.B., Girisuta
- Page 625 and 626:
PP-I-9Bykov V., Tsybenova S.B.DYNAM
- Page 627 and 628:
PP-I-43 Pechenegov Y.Y., Kuzmina R.
- Page 629 and 630:
PP-II-10 Basov N.L., Oreshkin I., T
- Page 631 and 632:
PP-II-45 Stepanek J., Koci P., Kubi
- Page 633 and 634:
PP-III-19 Fedorova Z.A., Danilova M
- Page 635 and 636:
PP-III-53 Pölczmann G., Valyon J.,
- Page 637:
XIX International Conference on Che