programming with max/msp - Virtual Sound
programming with max/msp - Virtual Sound
programming with max/msp - Virtual Sound

You also want an ePaper? Increase the reach of your titles
YUMPU automatically turns print PDFs into web optimized ePapers that Google loves.
1.2<br />
12<br />
Theory<br />
By the same reasoning, a 100 Hz wave has a wavelength of 3.44 meters. We<br />
see that frequency decreases <strong>with</strong> increasing wavelength, and the two quantities<br />
are, as we have said, inversely proportional.<br />
AMPLITUDE<br />
The second key parameter for sound is amplitude, which expresses information<br />
about variations in sound pressure, and which allows us to distinguish a loud<br />
sound from one of weaker intensity.<br />
A sound pressure that is weaker than the human ear can hear is said to lie<br />
below the threshold of hearing, while the <strong>max</strong>imum sound pressure that can<br />
be tolerated by the human ear is defined as the threshold of pain. Exposure<br />
to sounds above the threshold of pain results in physical pain and permanent<br />
hearing damage.<br />
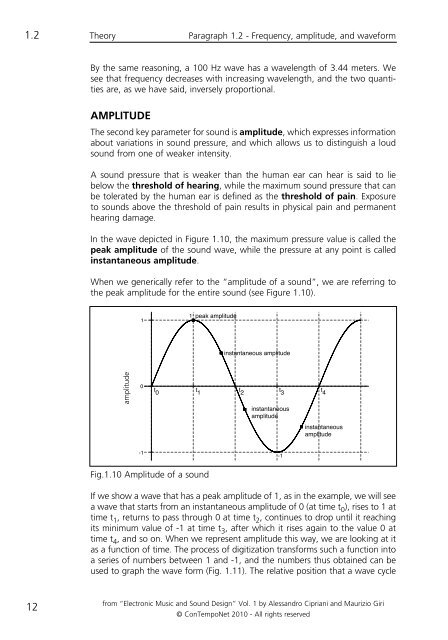
In the wave depicted in Figure 1.10, the <strong>max</strong>imum pressure value is called the<br />
peak amplitude of the sound wave, while the pressure at any point is called<br />
instantaneous amplitude.<br />
When we generically refer to the “amplitude of a sound”, we are referring to<br />
the peak amplitude for the entire sound (see Figure 1.10).<br />
amplitude<br />
�<br />
�<br />
��<br />
Fig.1.10 Amplitude of a sound<br />
� �<br />
Paragraph 1.2 - Frequency, amplitude, and waveform<br />
� ��������������<br />
�����������������������<br />
��� �<br />
�� �<br />
�<br />
��� �<br />
���<br />
�<br />
��������������<br />
���������<br />
If we show a wave that has a peak amplitude of 1, as in the example, we will see<br />
a wave that starts from an instantaneous amplitude of 0 (at time t 0 ), rises to 1 at<br />
time t 1 , returns to pass through 0 at time t 2 , continues to drop until it reaching<br />
its minimum value of -1 at time t 3 , after which it rises again to the value 0 at<br />
time t 4 , and so on. When we represent amplitude this way, we are looking at it<br />
as a function of time. The process of digitization transforms such a function into<br />
a series of numbers between 1 and -1, and the numbers thus obtained can be<br />
used to graph the wave form (Fig. 1.11). The relative position that a wave cycle<br />
from “Electronic Music and <strong>Sound</strong> Design” Vol. 1 by Alessandro Cipriani and Maurizio Giri<br />
© ConTempoNet 2010 - All rights reserved<br />
��<br />
��������������<br />
���������