programming with max/msp - Virtual Sound
programming with max/msp - Virtual Sound
programming with max/msp - Virtual Sound

You also want an ePaper? Increase the reach of your titles
YUMPU automatically turns print PDFs into web optimized ePapers that Google loves.
Chapter 2T - Additive and vector synthesis<br />
2.1 FIXED SPECTRUM ADDITIVE SYNTHESIS<br />
A sound produced by an acoustic instrument, any sound at all, is a set of complex<br />
oscillations, all produced simultaneously by the instrument in question.<br />
Each oscillation contributes a piece of the overall timbre of the sound, and their<br />
sum wholly determines the resulting waveform. However, this summed set of<br />
oscillations, this complex waveform, can also be described as a group of more<br />
elementary vibrations: sine waves.<br />
Sine waves are the basic building blocks <strong>with</strong> which it is possible to construct<br />
all other waveforms. When used in this way, we call the sine waves frequency<br />
components, and each frequency component in the composite wave has its<br />
own frequency, amplitude, and phase. The set of frequencies, amplitudes, and<br />
phases that completely define a given sound is called its sound spectrum. Any<br />
sound, natural or synthesized, can be decomposed into a group of frequency<br />
components. Synthesized waveforms such as we described in Section 1.2 are no<br />
exception; each has its own unique sound spectrum, and can be built up from a<br />
mixture of sine waves. (Sine waves themselves are self-describing – they contain<br />
only themselves as components!).<br />
SPECTRUM AND WAVEFORM<br />
Spectrum and waveform are two different ways to describe a single sound.<br />
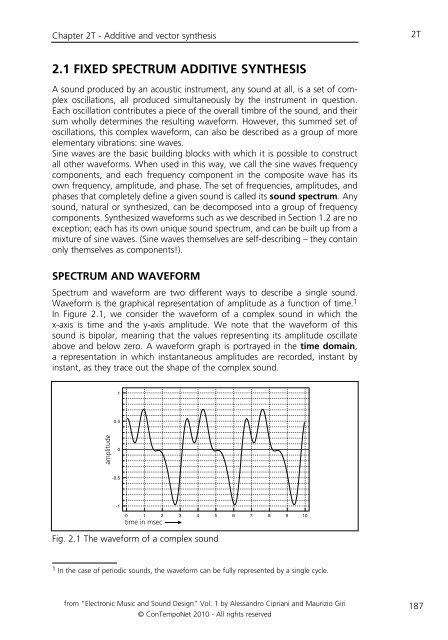
Waveform is the graphical representation of amplitude as a function of time. 1<br />
In Figure 2.1, we consider the waveform of a complex sound in which the<br />
x-axis is time and the y-axis amplitude. We note that the waveform of this<br />
sound is bipolar, meaning that the values representing its amplitude oscillate<br />
above and below zero. A waveform graph is portrayed in the time domain,<br />
a representation in which instantaneous amplitudes are recorded, instant by<br />
instant, as they trace out the shape of the complex sound.<br />
amplitude<br />
�<br />
���<br />
�<br />
����<br />
��<br />
� � � � � � � � � � ��<br />
time in msec<br />
Fig. 2.1 The waveform of a complex sound<br />
1 In the case of periodic sounds, the waveform can be fully represented by a single cycle.<br />
from “Electronic Music and <strong>Sound</strong> Design” Vol. 1 by Alessandro Cipriani and Maurizio Giri<br />
© ConTempoNet 2010 - All rights reserved<br />
2T<br />
187