analysis of the influences of solar radiation and façade glazing ...
analysis of the influences of solar radiation and façade glazing ...
analysis of the influences of solar radiation and façade glazing ...

Create successful ePaper yourself
Turn your PDF publications into a flip-book with our unique Google optimized e-Paper software.
3.1 Building description 67<br />
Fig. 3.15: Daily average outdoor dry bulb temperature during hot periods.<br />
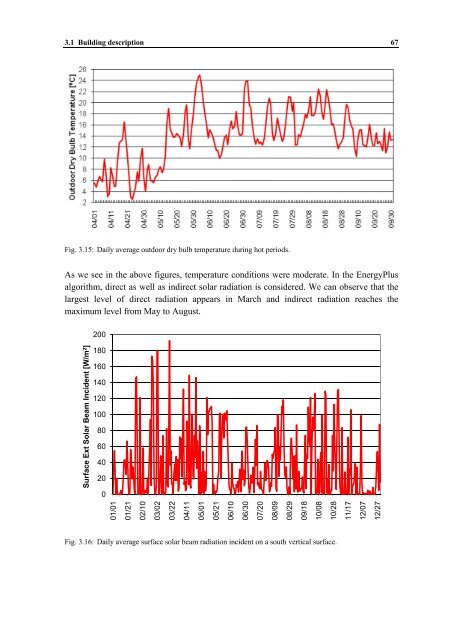
As we see in <strong>the</strong> above figures, temperature conditions were moderate. In <strong>the</strong> EnergyPlus<br />
algorithm, direct as well as indirect <strong>solar</strong> <strong>radiation</strong> is considered. We can observe that <strong>the</strong><br />
largest level <strong>of</strong> direct <strong>radiation</strong> appears in March <strong>and</strong> indirect <strong>radiation</strong> reaches <strong>the</strong><br />
maximum level from May to August.<br />
Surface Ext Solar Beam Incident [W/m 2 ]<br />
200<br />
180<br />
160<br />
140<br />
120<br />
100<br />
80<br />
60<br />
40<br />
20<br />
0<br />
01/01<br />
01/21<br />
02/10<br />
03/02<br />
03/22<br />
04/11<br />
05/01<br />
Fig. 3.16: Daily average surface <strong>solar</strong> beam <strong>radiation</strong> incident on a south vertical surface.<br />
05/21<br />
06/10<br />
06/30<br />
07/20<br />
08/09<br />
08/29<br />
09/18<br />
10/08<br />
10/28<br />
11/17<br />
12/07<br />
12/27