Download the Tutorial
Download the Tutorial
Download the Tutorial

You also want an ePaper? Increase the reach of your titles
YUMPU automatically turns print PDFs into web optimized ePapers that Google loves.
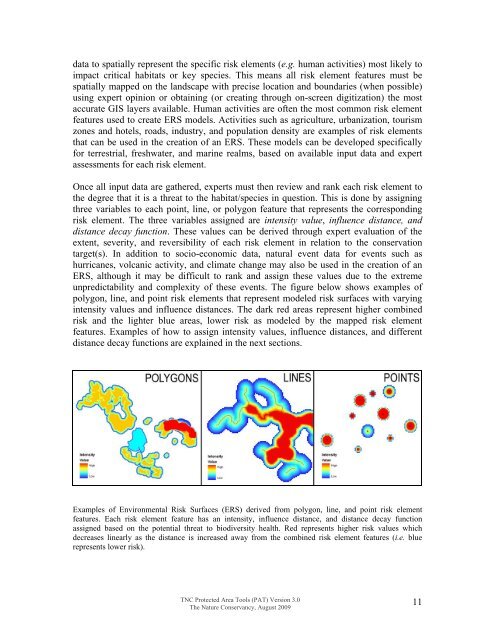
data to spatially represent <strong>the</strong> specific risk elements (e.g. human activities) most likely toimpact critical habitats or key species. This means all risk element features must bespatially mapped on <strong>the</strong> landscape with precise location and boundaries (when possible)using expert opinion or obtaining (or creating through on-screen digitization) <strong>the</strong> mostaccurate GIS layers available. Human activities are often <strong>the</strong> most common risk elementfeatures used to create ERS models. Activities such as agriculture, urbanization, tourismzones and hotels, roads, industry, and population density are examples of risk elementsthat can be used in <strong>the</strong> creation of an ERS. These models can be developed specificallyfor terrestrial, freshwater, and marine realms, based on available input data and expertassessments for each risk element.Once all input data are ga<strong>the</strong>red, experts must <strong>the</strong>n review and rank each risk element to<strong>the</strong> degree that it is a threat to <strong>the</strong> habitat/species in question. This is done by assigningthree variables to each point, line, or polygon feature that represents <strong>the</strong> correspondingrisk element. The three variables assigned are intensity value, influence distance, anddistance decay function. These values can be derived through expert evaluation of <strong>the</strong>extent, severity, and reversibility of each risk element in relation to <strong>the</strong> conservationtarget(s). In addition to socio-economic data, natural event data for events such ashurricanes, volcanic activity, and climate change may also be used in <strong>the</strong> creation of anERS, although it may be difficult to rank and assign <strong>the</strong>se values due to <strong>the</strong> extremeunpredictability and complexity of <strong>the</strong>se events. The figure below shows examples ofpolygon, line, and point risk elements that represent modeled risk surfaces with varyingintensity values and influence distances. The dark red areas represent higher combinedrisk and <strong>the</strong> lighter blue areas, lower risk as modeled by <strong>the</strong> mapped risk elementfeatures. Examples of how to assign intensity values, influence distances, and differentdistance decay functions are explained in <strong>the</strong> next sections.Examples of Environmental Risk Surfaces (ERS) derived from polygon, line, and point risk elementfeatures. Each risk element feature has an intensity, influence distance, and distance decay functionassigned based on <strong>the</strong> potential threat to biodiversity health. Red represents higher risk values whichdecreases linearly as <strong>the</strong> distance is increased away from <strong>the</strong> combined risk element features (i.e. bluerepresents lower risk).TNC Protected Area Tools (PAT) Version 3.0The Nature Conservancy, August 200911