Download the Tutorial
Download the Tutorial
Download the Tutorial

You also want an ePaper? Increase the reach of your titles
YUMPU automatically turns print PDFs into web optimized ePapers that Google loves.
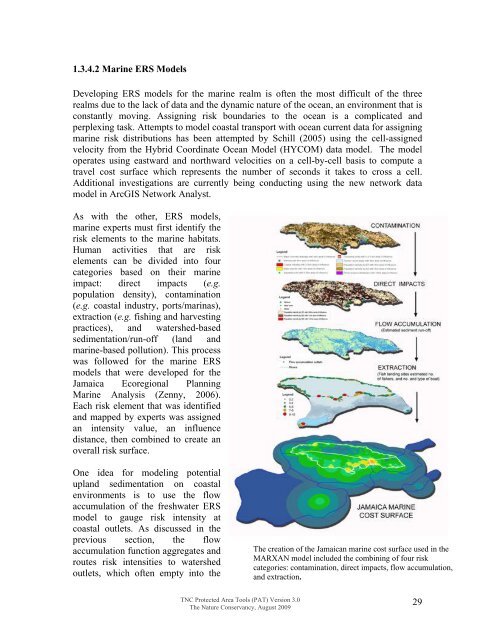
1.3.4.2 Marine ERS ModelsDeveloping ERS models for <strong>the</strong> marine realm is often <strong>the</strong> most difficult of <strong>the</strong> threerealms due to <strong>the</strong> lack of data and <strong>the</strong> dynamic nature of <strong>the</strong> ocean, an environment that isconstantly moving. Assigning risk boundaries to <strong>the</strong> ocean is a complicated andperplexing task. Attempts to model coastal transport with ocean current data for assigningmarine risk distributions has been attempted by Schill (2005) using <strong>the</strong> cell-assignedvelocity from <strong>the</strong> Hybrid Coordinate Ocean Model (HYCOM) data model. The modeloperates using eastward and northward velocities on a cell-by-cell basis to compute atravel cost surface which represents <strong>the</strong> number of seconds it takes to cross a cell.Additional investigations are currently being conducting using <strong>the</strong> new network datamodel in ArcGIS Network Analyst.As with <strong>the</strong> o<strong>the</strong>r, ERS models,marine experts must first identify <strong>the</strong>risk elements to <strong>the</strong> marine habitats.Human activities that are riskelements can be divided into fourcategories based on <strong>the</strong>ir marineimpact: direct impacts (e.g.population density), contamination(e.g. coastal industry, ports/marinas),extraction (e.g. fishing and harvestingpractices), and watershed-basedsedimentation/run-off (land andmarine-based pollution). This processwas followed for <strong>the</strong> marine ERSmodels that were developed for <strong>the</strong>Jamaica Ecoregional PlanningMarine Analysis (Zenny, 2006).Each risk element that was identifiedand mapped by experts was assignedan intensity value, an influencedistance, <strong>the</strong>n combined to create anoverall risk surface.One idea for modeling potentialupland sedimentation on coastalenvironments is to use <strong>the</strong> flowaccumulation of <strong>the</strong> freshwater ERSmodel to gauge risk intensity atcoastal outlets. As discussed in <strong>the</strong>previous section, <strong>the</strong> flowaccumulation function aggregates androutes risk intensities to watershedoutlets, which often empty into <strong>the</strong>The creation of <strong>the</strong> Jamaican marine cost surface used in <strong>the</strong>MARXAN model included <strong>the</strong> combining of four riskcategories: contamination, direct impacts, flow accumulation,and extraction.TNC Protected Area Tools (PAT) Version 3.0The Nature Conservancy, August 200929