Download the Tutorial
Download the Tutorial
Download the Tutorial

You also want an ePaper? Increase the reach of your titles
YUMPU automatically turns print PDFs into web optimized ePapers that Google loves.
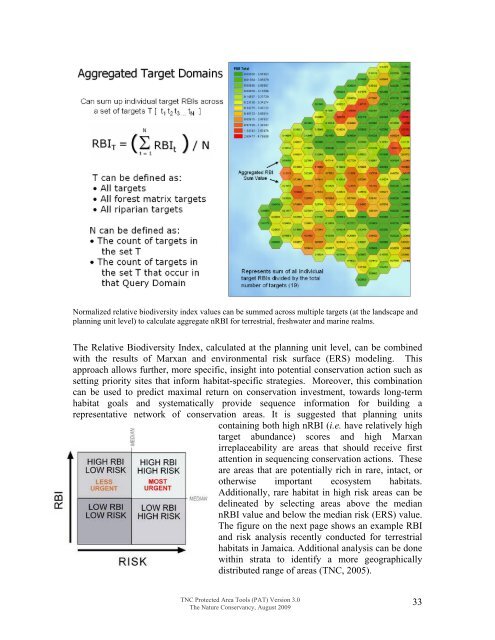
Normalized relative biodiversity index values can be summed across multiple targets (at <strong>the</strong> landscape andplanning unit level) to calculate aggregate nRBI for terrestrial, freshwater and marine realms.The Relative Biodiversity Index, calculated at <strong>the</strong> planning unit level, can be combinedwith <strong>the</strong> results of Marxan and environmental risk surface (ERS) modeling. Thisapproach allows fur<strong>the</strong>r, more specific, insight into potential conservation action such assetting priority sites that inform habitat-specific strategies. Moreover, this combinationcan be used to predict maximal return on conservation investment, towards long-termhabitat goals and systematically provide sequence information for building arepresentative network of conservation areas. It is suggested that planning unitscontaining both high nRBI (i.e. have relatively hightarget abundance) scores and high Marxanirreplaceability are areas that should receive firstattention in sequencing conservation actions. Theseare areas that are potentially rich in rare, intact, oro<strong>the</strong>rwise important ecosystem habitats.Additionally, rare habitat in high risk areas can bedelineated by selecting areas above <strong>the</strong> mediannRBI value and below <strong>the</strong> median risk (ERS) value.The figure on <strong>the</strong> next page shows an example RBIand risk analysis recently conducted for terrestrialhabitats in Jamaica. Additional analysis can be donewithin strata to identify a more geographicallydistributed range of areas (TNC, 2005).TNC Protected Area Tools (PAT) Version 3.0The Nature Conservancy, August 200933