a. Select <strong>the</strong> risk layers that you want to include in <strong>the</strong> ERS analysis by clicking on<strong>the</strong>m in <strong>the</strong> ERS interface window. Once selected, <strong>the</strong>y appear highlighted andwill be used in <strong>the</strong> model. Click to unselect.b. Specify an Output Raster. This should be a valid raster name. You can saveyour output GRID, IMG, personal geodatabase, file geodatabase, ArcSDEgeodatabase, or non georeferenced formats (BMP, GIF, JPEG, JPEG 2000, PNG,TIFF). When storing a raster dataset in a geodatabase, no file extension should beadded to <strong>the</strong> name of <strong>the</strong> raster dataset. When storing <strong>the</strong> raster dataset in a fileformat, you need to specify <strong>the</strong> file extension: .bmp for BMP, .gif for GIF, .imgfor an ERDAS IMAGINE file, .jpg for JPEG, .jp2 for JPEG 2000, .png for PNG,.tif for TIFF, or no extension for GRID. The output grid should not be written toa directory that has a space in <strong>the</strong> name or in <strong>the</strong> directory path.• The output grid name cannot be over 13 characters long.• The output grid name cannot contain spaces. Underscores are permitted.• The output grid name cannot contain special characters; for example, #, @, %The output grid name cannot begin with numbers. You may also specify a rastercatalog location to save your output to. If you specify a raster catalog output, youmust specify <strong>the</strong> name for <strong>the</strong> raster catalog item in <strong>the</strong> “Raster Catalog Item” boxdescribed below. This box will be grayed out unless you have specified a rastercatalog output. When specifying a raster catalog location for output, your finalresult will not be added to <strong>the</strong> map. You will need to manually load <strong>the</strong> data intoArcMap.c. If you have specified your output as Raster Catalog specify a name for <strong>the</strong> RasterCatalog Item that will be created.d. Enter <strong>the</strong> Intensity Scale Max field. This represents <strong>the</strong> <strong>the</strong>oretical maximumvalue for intensity. It represents <strong>the</strong> maximum value in <strong>the</strong> scale of all yourintensity values. In o<strong>the</strong>r words, if you have established your intensity values ona scale from 0.0 – 1.0 enter a value of 1 in <strong>the</strong> Intensity Scale Max field. The tooldoes not support using a value o<strong>the</strong>r than 0 as <strong>the</strong> minimum scale value. You mayor may not actually have any intensity values assigned to <strong>the</strong> value you enter here.For <strong>the</strong> tutorial data, we will use a scale of 0-100, so enter <strong>the</strong> value of 100 as <strong>the</strong>maximum intensity value.e. Enter <strong>the</strong> Output Cell Size. This is <strong>the</strong> desired cell size of <strong>the</strong> final output grid.The default value is 30m. Remember that <strong>the</strong> smaller <strong>the</strong> cell size, <strong>the</strong> longer <strong>the</strong>computation time (exponentially) and <strong>the</strong> more hard disk space required. Runtime also depends on <strong>the</strong> scale you are working at and <strong>the</strong> number of uniqueintensity values that you have defined. It is a good idea to experiment with cellsizes to get an idea of run time and space requirements. All input distances needto be specified in <strong>the</strong> same units as <strong>the</strong> input data (i.e. all inputs should use <strong>the</strong>same units). Also, if you have defined an influence distance less than <strong>the</strong> cell size,TNC Protected Area Tools (PAT) Version 3.0The Nature Conservancy, August 200920
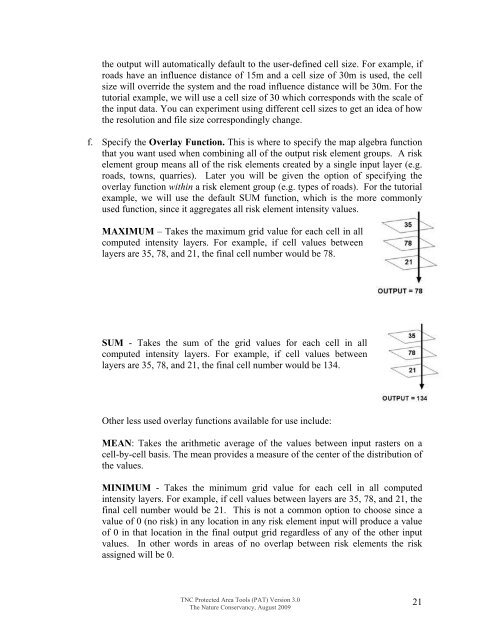
<strong>the</strong> output will automatically default to <strong>the</strong> user-defined cell size. For example, ifroads have an influence distance of 15m and a cell size of 30m is used, <strong>the</strong> cellsize will override <strong>the</strong> system and <strong>the</strong> road influence distance will be 30m. For <strong>the</strong>tutorial example, we will use a cell size of 30 which corresponds with <strong>the</strong> scale of<strong>the</strong> input data. You can experiment using different cell sizes to get an idea of how<strong>the</strong> resolution and file size correspondingly change.f. Specify <strong>the</strong> Overlay Function. This is where to specify <strong>the</strong> map algebra functionthat you want used when combining all of <strong>the</strong> output risk element groups. A riskelement group means all of <strong>the</strong> risk elements created by a single input layer (e.g.roads, towns, quarries). Later you will be given <strong>the</strong> option of specifying <strong>the</strong>overlay function within a risk element group (e.g. types of roads). For <strong>the</strong> tutorialexample, we will use <strong>the</strong> default SUM function, which is <strong>the</strong> more commonlyused function, since it aggregates all risk element intensity values.MAXIMUM – Takes <strong>the</strong> maximum grid value for each cell in allcomputed intensity layers. For example, if cell values betweenlayers are 35, 78, and 21, <strong>the</strong> final cell number would be 78.SUM - Takes <strong>the</strong> sum of <strong>the</strong> grid values for each cell in allcomputed intensity layers. For example, if cell values betweenlayers are 35, 78, and 21, <strong>the</strong> final cell number would be 134.O<strong>the</strong>r less used overlay functions available for use include:MEAN: Takes <strong>the</strong> arithmetic average of <strong>the</strong> values between input rasters on acell-by-cell basis. The mean provides a measure of <strong>the</strong> center of <strong>the</strong> distribution of<strong>the</strong> values.MINIMUM - Takes <strong>the</strong> minimum grid value for each cell in all computedintensity layers. For example, if cell values between layers are 35, 78, and 21, <strong>the</strong>final cell number would be 21. This is not a common option to choose since avalue of 0 (no risk) in any location in any risk element input will produce a valueof 0 in that location in <strong>the</strong> final output grid regardless of any of <strong>the</strong> o<strong>the</strong>r inputvalues. In o<strong>the</strong>r words in areas of no overlap between risk elements <strong>the</strong> riskassigned will be 0.TNC Protected Area Tools (PAT) Version 3.0The Nature Conservancy, August 200921