Download the Tutorial
Download the Tutorial
Download the Tutorial

Create successful ePaper yourself
Turn your PDF publications into a flip-book with our unique Google optimized e-Paper software.
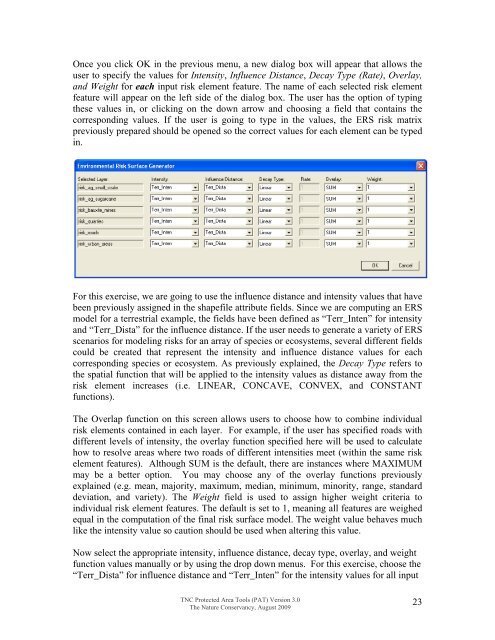
Once you click OK in <strong>the</strong> previous menu, a new dialog box will appear that allows <strong>the</strong>user to specify <strong>the</strong> values for Intensity, Influence Distance, Decay Type (Rate), Overlay,and Weight for each input risk element feature. The name of each selected risk elementfeature will appear on <strong>the</strong> left side of <strong>the</strong> dialog box. The user has <strong>the</strong> option of typing<strong>the</strong>se values in, or clicking on <strong>the</strong> down arrow and choosing a field that contains <strong>the</strong>corresponding values. If <strong>the</strong> user is going to type in <strong>the</strong> values, <strong>the</strong> ERS risk matrixpreviously prepared should be opened so <strong>the</strong> correct values for each element can be typedin.For this exercise, we are going to use <strong>the</strong> influence distance and intensity values that havebeen previously assigned in <strong>the</strong> shapefile attribute fields. Since we are computing an ERSmodel for a terrestrial example, <strong>the</strong> fields have been defined as “Terr_Inten” for intensityand “Terr_Dista” for <strong>the</strong> influence distance. If <strong>the</strong> user needs to generate a variety of ERSscenarios for modeling risks for an array of species or ecosystems, several different fieldscould be created that represent <strong>the</strong> intensity and influence distance values for eachcorresponding species or ecosystem. As previously explained, <strong>the</strong> Decay Type refers to<strong>the</strong> spatial function that will be applied to <strong>the</strong> intensity values as distance away from <strong>the</strong>risk element increases (i.e. LINEAR, CONCAVE, CONVEX, and CONSTANTfunctions).The Overlap function on this screen allows users to choose how to combine individualrisk elements contained in each layer. For example, if <strong>the</strong> user has specified roads withdifferent levels of intensity, <strong>the</strong> overlay function specified here will be used to calculatehow to resolve areas where two roads of different intensities meet (within <strong>the</strong> same riskelement features). Although SUM is <strong>the</strong> default, <strong>the</strong>re are instances where MAXIMUMmay be a better option. You may choose any of <strong>the</strong> overlay functions previouslyexplained (e.g. mean, majority, maximum, median, minimum, minority, range, standarddeviation, and variety). The Weight field is used to assign higher weight criteria toindividual risk element features. The default is set to 1, meaning all features are weighedequal in <strong>the</strong> computation of <strong>the</strong> final risk surface model. The weight value behaves muchlike <strong>the</strong> intensity value so caution should be used when altering this value.Now select <strong>the</strong> appropriate intensity, influence distance, decay type, overlay, and weightfunction values manually or by using <strong>the</strong> drop down menus. For this exercise, choose <strong>the</strong>“Terr_Dista” for influence distance and “Terr_Inten” for <strong>the</strong> intensity values for all inputTNC Protected Area Tools (PAT) Version 3.0The Nature Conservancy, August 200923