Download the Tutorial
Download the Tutorial
Download the Tutorial

Create successful ePaper yourself
Turn your PDF publications into a flip-book with our unique Google optimized e-Paper software.
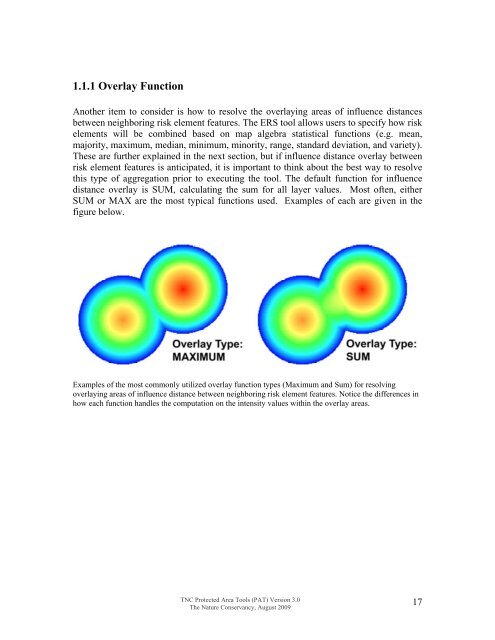
1.1.1 Overlay FunctionAno<strong>the</strong>r item to consider is how to resolve <strong>the</strong> overlaying areas of influence distancesbetween neighboring risk element features. The ERS tool allows users to specify how riskelements will be combined based on map algebra statistical functions (e.g. mean,majority, maximum, median, minimum, minority, range, standard deviation, and variety).These are fur<strong>the</strong>r explained in <strong>the</strong> next section, but if influence distance overlay betweenrisk element features is anticipated, it is important to think about <strong>the</strong> best way to resolvethis type of aggregation prior to executing <strong>the</strong> tool. The default function for influencedistance overlay is SUM, calculating <strong>the</strong> sum for all layer values. Most often, ei<strong>the</strong>rSUM or MAX are <strong>the</strong> most typical functions used. Examples of each are given in <strong>the</strong>figure below.Examples of <strong>the</strong> most commonly utilized overlay function types (Maximum and Sum) for resolvingoverlaying areas of influence distance between neighboring risk element features. Notice <strong>the</strong> differences inhow each function handles <strong>the</strong> computation on <strong>the</strong> intensity values within <strong>the</strong> overlay areas.TNC Protected Area Tools (PAT) Version 3.0The Nature Conservancy, August 200917