Download the Tutorial
Download the Tutorial
Download the Tutorial

Create successful ePaper yourself
Turn your PDF publications into a flip-book with our unique Google optimized e-Paper software.
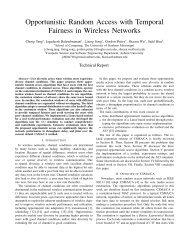
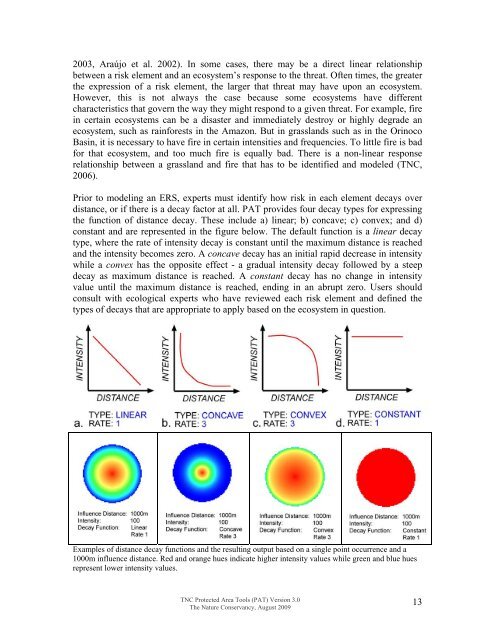
2003, Araújo et al. 2002). In some cases, <strong>the</strong>re may be a direct linear relationshipbetween a risk element and an ecosystem’s response to <strong>the</strong> threat. Often times, <strong>the</strong> greater<strong>the</strong> expression of a risk element, <strong>the</strong> larger that threat may have upon an ecosystem.However, this is not always <strong>the</strong> case because some ecosystems have differentcharacteristics that govern <strong>the</strong> way <strong>the</strong>y might respond to a given threat. For example, firein certain ecosystems can be a disaster and immediately destroy or highly degrade anecosystem, such as rainforests in <strong>the</strong> Amazon. But in grasslands such as in <strong>the</strong> OrinocoBasin, it is necessary to have fire in certain intensities and frequencies. To little fire is badfor that ecosystem, and too much fire is equally bad. There is a non-linear responserelationship between a grassland and fire that has to be identified and modeled (TNC,2006).Prior to modeling an ERS, experts must identify how risk in each element decays overdistance, or if <strong>the</strong>re is a decay factor at all. PAT provides four decay types for expressing<strong>the</strong> function of distance decay. These include a) linear; b) concave; c) convex; and d)constant and are represented in <strong>the</strong> figure below. The default function is a linear decaytype, where <strong>the</strong> rate of intensity decay is constant until <strong>the</strong> maximum distance is reachedand <strong>the</strong> intensity becomes zero. A concave decay has an initial rapid decrease in intensitywhile a convex has <strong>the</strong> opposite effect - a gradual intensity decay followed by a steepdecay as maximum distance is reached. A constant decay has no change in intensityvalue until <strong>the</strong> maximum distance is reached, ending in an abrupt zero. Users shouldconsult with ecological experts who have reviewed each risk element and defined <strong>the</strong>types of decays that are appropriate to apply based on <strong>the</strong> ecosystem in question.Examples of distance decay functions and <strong>the</strong> resulting output based on a single point occurrence and a1000m influence distance. Red and orange hues indicate higher intensity values while green and blue huesrepresent lower intensity values.TNC Protected Area Tools (PAT) Version 3.0The Nature Conservancy, August 200913