Download the Tutorial
Download the Tutorial
Download the Tutorial

Create successful ePaper yourself
Turn your PDF publications into a flip-book with our unique Google optimized e-Paper software.
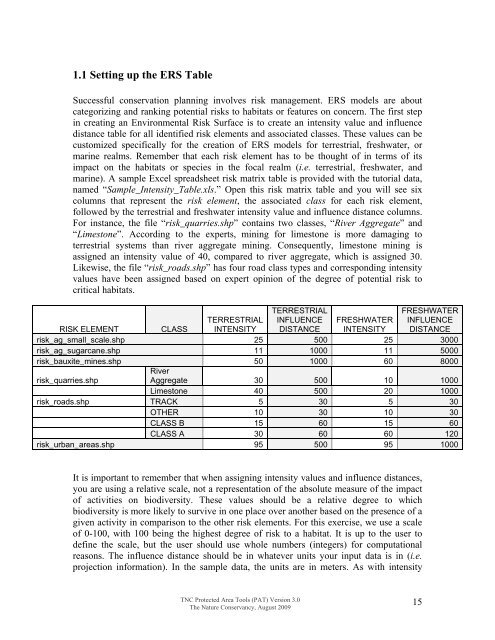
1.1 Setting up <strong>the</strong> ERS TableSuccessful conservation planning involves risk management. ERS models are aboutcategorizing and ranking potential risks to habitats or features on concern. The first stepin creating an Environmental Risk Surface is to create an intensity value and influencedistance table for all identified risk elements and associated classes. These values can becustomized specifically for <strong>the</strong> creation of ERS models for terrestrial, freshwater, ormarine realms. Remember that each risk element has to be thought of in terms of itsimpact on <strong>the</strong> habitats or species in <strong>the</strong> focal realm (i.e. terrestrial, freshwater, andmarine). A sample Excel spreadsheet risk matrix table is provided with <strong>the</strong> tutorial data,named “Sample_Intensity_Table.xls.” Open this risk matrix table and you will see sixcolumns that represent <strong>the</strong> risk element, <strong>the</strong> associated class for each risk element,followed by <strong>the</strong> terrestrial and freshwater intensity value and influence distance columns.For instance, <strong>the</strong> file “risk_quarries.shp” contains two classes, “River Aggregate” and“Limestone”. According to <strong>the</strong> experts, mining for limestone is more damaging toterrestrial systems than river aggregate mining. Consequently, limestone mining isassigned an intensity value of 40, compared to river aggregate, which is assigned 30.Likewise, <strong>the</strong> file “risk_roads.shp” has four road class types and corresponding intensityvalues have been assigned based on expert opinion of <strong>the</strong> degree of potential risk tocritical habitats.TERRESTRIALINFLUENCEDISTANCEFRESHWATERINFLUENCEDISTANCERISK ELEMENTCLASSTERRESTRIALINTENSITYFRESHWATERINTENSITYrisk_ag_small_scale.shp 25 500 25 3000risk_ag_sugarcane.shp 11 1000 11 5000risk_bauxite_mines.shp 50 1000 60 8000risk_quarries.shpRiverAggregate 30 500 10 1000Limestone 40 500 20 1000risk_roads.shp TRACK 5 30 5 30OTHER 10 30 10 30CLASS B 15 60 15 60CLASS A 30 60 60 120risk_urban_areas.shp 95 500 95 1000It is important to remember that when assigning intensity values and influence distances,you are using a relative scale, not a representation of <strong>the</strong> absolute measure of <strong>the</strong> impactof activities on biodiversity. These values should be a relative degree to whichbiodiversity is more likely to survive in one place over ano<strong>the</strong>r based on <strong>the</strong> presence of agiven activity in comparison to <strong>the</strong> o<strong>the</strong>r risk elements. For this exercise, we use a scaleof 0-100, with 100 being <strong>the</strong> highest degree of risk to a habitat. It is up to <strong>the</strong> user todefine <strong>the</strong> scale, but <strong>the</strong> user should use whole numbers (integers) for computationalreasons. The influence distance should be in whatever units your input data is in (i.e.projection information). In <strong>the</strong> sample data, <strong>the</strong> units are in meters. As with intensityTNC Protected Area Tools (PAT) Version 3.0The Nature Conservancy, August 200915