Download the Tutorial
Download the Tutorial
Download the Tutorial

You also want an ePaper? Increase the reach of your titles
YUMPU automatically turns print PDFs into web optimized ePapers that Google loves.
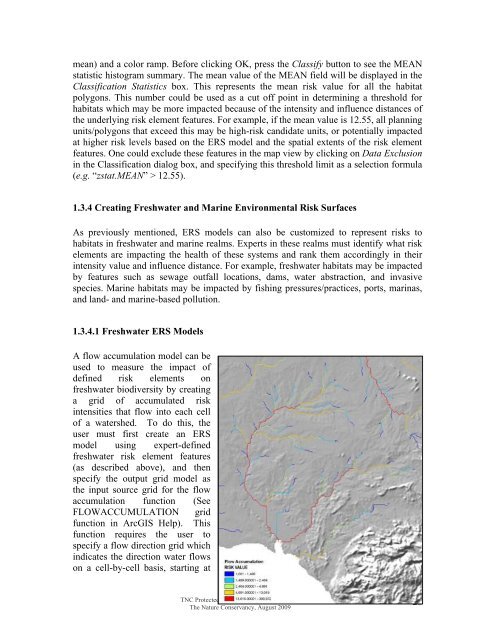
mean) and a color ramp. Before clicking OK, press <strong>the</strong> Classify button to see <strong>the</strong> MEANstatistic histogram summary. The mean value of <strong>the</strong> MEAN field will be displayed in <strong>the</strong>Classification Statistics box. This represents <strong>the</strong> mean risk value for all <strong>the</strong> habitatpolygons. This number could be used as a cut off point in determining a threshold forhabitats which may be more impacted because of <strong>the</strong> intensity and influence distances of<strong>the</strong> underlying risk element features. For example, if <strong>the</strong> mean value is 12.55, all planningunits/polygons that exceed this may be high-risk candidate units, or potentially impactedat higher risk levels based on <strong>the</strong> ERS model and <strong>the</strong> spatial extents of <strong>the</strong> risk elementfeatures. One could exclude <strong>the</strong>se features in <strong>the</strong> map view by clicking on Data Exclusionin <strong>the</strong> Classification dialog box, and specifying this threshold limit as a selection formula(e.g. “zstat.MEAN” > 12.55).1.3.4 Creating Freshwater and Marine Environmental Risk SurfacesAs previously mentioned, ERS models can also be customized to represent risks tohabitats in freshwater and marine realms. Experts in <strong>the</strong>se realms must identify what riskelements are impacting <strong>the</strong> health of <strong>the</strong>se systems and rank <strong>the</strong>m accordingly in <strong>the</strong>irintensity value and influence distance. For example, freshwater habitats may be impactedby features such as sewage outfall locations, dams, water abstraction, and invasivespecies. Marine habitats may be impacted by fishing pressures/practices, ports, marinas,and land- and marine-based pollution.1.3.4.1 Freshwater ERS ModelsA flow accumulation model can beused to measure <strong>the</strong> impact ofdefined risk elements onfreshwater biodiversity by creatinga grid of accumulated riskintensities that flow into each cellof a watershed. To do this, <strong>the</strong>user must first create an ERSmodel using expert-definedfreshwater risk element features(as described above), and <strong>the</strong>nspecify <strong>the</strong> output grid model as<strong>the</strong> input source grid for <strong>the</strong> flowaccumulation function (SeeFLOWACCUMULATION gridfunction in ArcGIS Help). Thisfunction requires <strong>the</strong> user tospecify a flow direction grid whichindicates <strong>the</strong> direction water flowson a cell-by-cell basis, starting atTNC Protected Area Tools (PAT) Version 3.026The Nature Conservancy, August 2009