Download the Tutorial
Download the Tutorial
Download the Tutorial

Create successful ePaper yourself
Turn your PDF publications into a flip-book with our unique Google optimized e-Paper software.
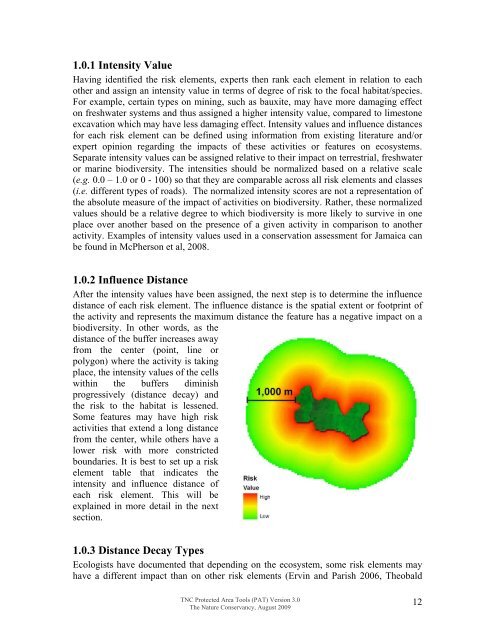
1.0.1 Intensity ValueHaving identified <strong>the</strong> risk elements, experts <strong>the</strong>n rank each element in relation to eacho<strong>the</strong>r and assign an intensity value in terms of degree of risk to <strong>the</strong> focal habitat/species.For example, certain types on mining, such as bauxite, may have more damaging effecton freshwater systems and thus assigned a higher intensity value, compared to limestoneexcavation which may have less damaging effect. Intensity values and influence distancesfor each risk element can be defined using information from existing literature and/orexpert opinion regarding <strong>the</strong> impacts of <strong>the</strong>se activities or features on ecosystems.Separate intensity values can be assigned relative to <strong>the</strong>ir impact on terrestrial, freshwateror marine biodiversity. The intensities should be normalized based on a relative scale(e.g. 0.0 – 1.0 or 0 - 100) so that <strong>the</strong>y are comparable across all risk elements and classes(i.e. different types of roads). The normalized intensity scores are not a representation of<strong>the</strong> absolute measure of <strong>the</strong> impact of activities on biodiversity. Ra<strong>the</strong>r, <strong>the</strong>se normalizedvalues should be a relative degree to which biodiversity is more likely to survive in oneplace over ano<strong>the</strong>r based on <strong>the</strong> presence of a given activity in comparison to ano<strong>the</strong>ractivity. Examples of intensity values used in a conservation assessment for Jamaica canbe found in McPherson et al, 2008.1.0.2 Influence DistanceAfter <strong>the</strong> intensity values have been assigned, <strong>the</strong> next step is to determine <strong>the</strong> influencedistance of each risk element. The influence distance is <strong>the</strong> spatial extent or footprint of<strong>the</strong> activity and represents <strong>the</strong> maximum distance <strong>the</strong> feature has a negative impact on abiodiversity. In o<strong>the</strong>r words, as <strong>the</strong>distance of <strong>the</strong> buffer increases awayfrom <strong>the</strong> center (point, line orpolygon) where <strong>the</strong> activity is takingplace, <strong>the</strong> intensity values of <strong>the</strong> cellswithin <strong>the</strong> buffers diminishprogressively (distance decay) and<strong>the</strong> risk to <strong>the</strong> habitat is lessened.Some features may have high riskactivities that extend a long distancefrom <strong>the</strong> center, while o<strong>the</strong>rs have alower risk with more constrictedboundaries. It is best to set up a riskelement table that indicates <strong>the</strong>intensity and influence distance ofeach risk element. This will beexplained in more detail in <strong>the</strong> nextsection.1.0.3 Distance Decay TypesEcologists have documented that depending on <strong>the</strong> ecosystem, some risk elements mayhave a different impact than on o<strong>the</strong>r risk elements (Ervin and Parish 2006, TheobaldTNC Protected Area Tools (PAT) Version 3.0The Nature Conservancy, August 200912