~ ---~ ---------- - ---Sout!:eboci< <strong>of</strong> <strong>Criminal</strong> <strong>Justice</strong> <strong>Statistics</strong> <strong>1983</strong>Table 3.56 Estimated number and rate (per 100,000 Inhabitants) <strong>of</strong> affem;es known to police, by <strong>of</strong>fense, United States, 1960-81N)TE: These data were complied by the Federal <strong>Bureau</strong> <strong>of</strong> Investigationthrough the Unifbrm Crime Reporting Pragram. On a monthly basis, lawenforcement agencies (police, sheriffs, and State police) report thenumber <strong>of</strong> affenses that become Imown to them in the fallowing crimecategories: murder and nannegligent manslaughter, manslaughter bynegligence, forcible rape, robbery, assault, burglary, larceny-theft, andmotor vehicle theft. A count <strong>of</strong> these crimes, which are known as PartI affenses, is taken from records <strong>of</strong> all complaints af crime received bylow enforcement agencies from victims or other sources and/or from<strong>of</strong>ficers who discovered the affenses. Whenever complaints <strong>of</strong> crime aredetermined through investigation to be unfounded or false, they areeliminated from the actual count (SrJurce, p. 2).The Unifarm Crime Reporting Program uses seven crimecategaries tQ establish a "crime index" in order to measure the trendand distribution <strong>of</strong> crime in the United States. Crime index <strong>of</strong>fensesinclude murder and nonnegligent manslaughter, farcible rape, rabbery,aggravated assault, burglary, larceny-theft, and matar vehicle theft;the "Total Crime Il'idex" is a simple sum <strong>of</strong> the index affenses. Arsonwas designated as a Part I Index <strong>of</strong>fense in October 1978; datacollection was begun in 1979. However, due to the incompleteness <strong>of</strong>arson reporting by police in 1979 and 1980, arson data are notdisplayed nor are they included in the Total Crime Index <strong>of</strong> the<strong>of</strong>fenses knawn to the palice., The figuNls in this table are subject to updating by the UniformCrime Reporting Program. The number <strong>of</strong> agencies reporting andpapulations represented may vary from year to year. This table, Table3.58, and Table 3.59 present estimates for the United States arparticular areas based on agencies reporting. For definitions <strong>of</strong><strong>of</strong>fenses, see Appendix 2."Murderand nonnegligentPopulotian a TotalCrimEbIndexPropertycrime cmanslaughterForciblerape RabberyAggravatedassaultBurglaryLarcenytheftMotarvehicletheftNJrnber <strong>of</strong> affenses:1960 - 179,323,1751961 - 182,992,OUO1962 - 185,771,0001963 - I !!1:!,41:!3,UUU1964 - 191,141,000196!> - 193,526,0001966 - 195,576,0001%7 - 197,457,OUO1968 - 199,399,UOO1969 - 20 I ,385,0001970 - 203,235,2981971 - 2U6,212,0001972 - 208,230,tJOO1973 - 209,!!51,OOO1974 - 211,392,('.00197!> - 213,124,JUO1976 - 214,659,0001977 - 216,332,0001978 - 218,059,0001979 - 22U,rJ99,OUO1980 - 225,349,26419!!1 - 229,146,0003,31:!4,2UU3,488,00U3,7!>2,20U4,109,5004,564,60U4,739,4005,223,5UO5,903,4006,720,20U7,410,900!!,09B,0008,588,2008,24l'l,80U8,71!!,IOOIO,2~3,40011,256,60011,304,BUO10,935,80011,141,30U12,152,70013,29!l,400!3,290,30021l8,460 3,095,70U289,390 3,198,6003UI,510 3,45U,70U316,970 3,792,500364,220 4,20U,4UU387,390 4,352,00043U,I!!0 4,793,3UU499,930 5,403,500595,UIU 6,125,20U661,870 6,749,000738,82U 7,359,2UU816,500 7,771,700834,9UO 7,413,9UO1l75,910 7,842,200974,720 ~,278,7UU1,026,28U 10,230,30091l6,58U 10,318,2UU1,009,500 9,926,3001,061,830 IU,U79,5UO1,178,540 10,974,2001,30~,9UU 11,91:!6,5001,321,900 11,968,4009,1108,7408,53U8,6409,3609,96011,04U12,24013,80014,76016,00U17,78018,67019,6402u,71020,51018,71lU19,12019,56021,46023,04022,52017,19017,22017,55U17,65021,42023,41025,82027,62031,67037,17037,99042,26046,IlS051,40055,40056,09056,73U63,02067,13075,990!l2,09081,540107,840106,670110,860116,47013U,390138,690157,990202,910262,84U298,!!50349,86U387,700376,2903!!4,220442,40U464,970420,210404,850417,U40466,880548,810574,130154,320156,760164,57U174,210203,050215,330235,330257,160286,700311,090334,97U368,760393,090420,650456,210484,710490,850522,510558, IOU614,210654,96U643,720912,100949,600994,3UO1,086,4001,213,2001,282,5001,410,1001,632,1001,858,9001,981,9002,205,0002,399,30U2,375,5UO2,565,5003,039,20U3,252,1003,u89,8UO3,052,2003,104,5003,299,5003,759,2003,739,8001,855,40U1,913,0002,OB9,6002,297,BOO2,514,4UU2,572,6002,822,0003, 111,6003,482,7003,888,600il,225,8004,424,2004,151,2004,347,9005,262,5005,977,7006,270,8005,905,7005,9!l3,4006,577,5007,112,7007,154,500328,200336,000J66,1l00408,30U472,800496,90U561,ZOO659,8007!l3,6UO1l78,50092B,400948,200887,2UO928,800977,1001,00U,5OO957,600968,40U991,6001,097,2001,114,7UU1,074,000Rate per I 'J'a000inhabitants:1%01961196219631%41%51%61967I % I:!196919701971197219731974197519761977197!l1979191:!OI 91:! I1,!!!!7.21,906.12,019.!!2,11l0.32,3!!ll.12,449.02,670.8;;:,989.73,37U.23,680.03,9!!4.54,164.73,%1.44,154.44,85U.45,281.75,266.45,055.15, 10~.35,521.55,899.95,799.9160.9158.1162.3168.2190.6200.22LU.0253.229!l.4328.7363.5396.0401.0417.4461.1481.5459.8466.64!l6.9535.5580.8576.91,726.31,747.9I ,1:!!l7.52,012.12,197.52,248.82,450.92,736.53,071.83,351.33,621.03,768.83,560.43,737.04,389.34,800.24,806.!!4,588.44,622.44,986.05,319.15,223.05.14.84.64.64.95.15.66.26.97.37.98.69.09.49.89.68.88.89.09.710.29.!!9.69.49.49.411.212.113.214.015.918.518.720.522.!l24.526.226.326.429.130.1l34.536.435.66U.158.359.761.868.271.78U.8102.l.J131.8148.4172.1188.0IBO.7183.1209.3218.2195.8187.1191.3212.1243.5250.686.185.71l!!.692.4106.2111.3120.3130.2143.B154.5164.8178.8181l.8200.5215.B227.422B.7241.5255.9279.129U.6280.9508.6518.9535.2576.4634.7662.7721.0826.6932.3984.11,084.91,163.51,140.81,222.51,437.71,525.91,439.41,410.91,423.71,499.11,668.21,632.11,034.71,045.41,124.B1,219.11,315.51,329.31,442.91,575.81,746.61,930.92,079.32,145.51,993.62,071.92,489.52,804.82,921.32,729.92,743.92,988.43,156.33.122.31!l3.0183.6197.4216.6247.4256.B2!!6.9334. I393.0436.2456.84S9.B426.1442.646L.2469.4446.1447.6454.7498.5494.6468.7,;'\i..'"'"°Populations are U.S. <strong>Bureau</strong> <strong>of</strong> the Census pravlsional estimatesas <strong>of</strong> July I, except for the Apr. I, 1960, 1970, and 1980 preliminarycensu~ caunts, and are subject to change.Due to rounding, the <strong>of</strong>fenses may not odd ta totals.cViolent crimes are <strong>of</strong>fenses <strong>of</strong> murder, forcible rape, robbery,and aggravated assault. Property crimes are <strong>of</strong>fenses <strong>of</strong> burglary,larceny-theft, and motor vehicle theft. Data are not included for theproperJy crime <strong>of</strong> arson.Crime rates calculated priar to raunding number <strong>of</strong> <strong>of</strong>fenses.4\Source: U.S. Department <strong>of</strong> <strong>Justice</strong>, Federal <strong>Bureau</strong> <strong>of</strong> Investigation, Crime in the United States, 1975, p. 49, Table 2; 1976, p. 37; 1977, p.37, Table 2; 197B, p. 39; 1~79, p. 41; 19110, p. 41, Table 2; 1981, p. 39, Table 2 (Washington, D.C.: U.S. Government Printing Office). Table adaptedby SOLRCEBOO< staff.,370
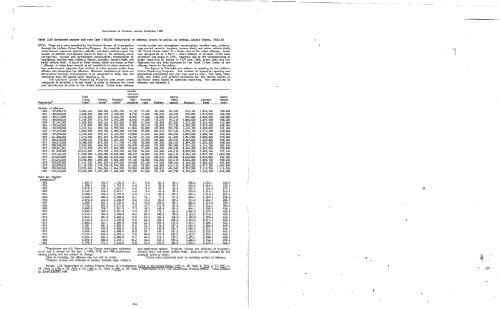
Figure 3.20 Estimated rate (per 100,000 inhabitants) <strong>of</strong> <strong>of</strong>fenses known to police, by type <strong>of</strong> <strong>of</strong>fense, lkIited States, 1960-81I\DTE: See I\DTE, Table 3.56. Violent crimes are <strong>of</strong>fenses <strong>of</strong> rrorder, forcible rape, robbery, and aggravatedassault. Property crimes are <strong>of</strong>fenses <strong>of</strong> burglary, larceny-theft, and motor vehicle theft. For definitions <strong>of</strong><strong>of</strong>fenses, see Appendix 2.(Rote per 100,000 inhabitants)6,0005,500Total Crime IndexProperty crime5,0004,5004,000.......w!a:3,5003,0002,5002,0001,5001,000500..•.•....•..............•..................................•..•.••.•.......•.............•.•..•...................... ,...............0 1974 1976 1978 1980 19811960 1962 1964 1966 1968 1970 1972Violent crimeSource: U.S. Deportment <strong>of</strong> <strong>Justice</strong>, Federal <strong>Bureau</strong> <strong>of</strong> Investigation, Crime in the United States, 1975, p. 49, Table 2; 1981, p. 39, Table 2 (Washington, D.C.:U.S. Government Printing Office). Figure constructed by Sa..RCEBCXl< st<strong>of</strong>f.\4\, I..,
- Page 1 and 2:
u.s. Department of JusticeBureau of
- Page 3 and 4:
________ n~'·••SOURCEBOOKOF CR
- Page 5 and 6:
Sourcebook of Criminal Justice Stat
- Page 7 and 8:
Figure B An overview of detelnclude
- Page 9 and 10:
--------- - --Svurcebook of Crimina
- Page 11 and 12:
- - .. "-- - ~------~ ------------C
- Page 13 and 14:
Figure3.12 Estimated rate (per 100,
- Page 15 and 16:
TableFig. 2.6 Respondents taking pr
- Page 17 and 18:
Sourcebook of Criminal Justice Stat
- Page 19 and 20:
---------- - -- ~------------------
- Page 21 and 22:
- ...... - ~r---~---------~--------
- Page 24 and 25:
------------- - ~------~-----~-----
- Page 26 and 27:
Sourcebook of Criminal Justice Stat
- Page 28 and 29:
--------- -' -- - -'-- ----~-------
- Page 30 and 31:
---- -- --~------~ ---rl.Sourcebook
- Page 32 and 33:
~~---------- ---~----------~-------
- Page 34 and 35:
-------------- - ---~---~--------~-
- Page 36 and 37:
~~~~~~~---- - -- -Sourcebook of Cri
- Page 38 and 39:
----.... ....--.-. ~"'-.~Sourcebook
- Page 40 and 41:
(Sourcebook of Criminal Justice Sta
- Page 42 and 43:
-----~---------------------.-'-----
- Page 44 and 45:
Table 1.13 Number and rateOct. 31,
- Page 46 and 47:
~-~- ~-...--~ -- ~ ---,~-------. -.
- Page 48 and 49:
-- ..... -,-.--..-... ~~----r; __ '
- Page 50 and 51:
---..0lIl, - -~,..--- -- - - ----~-
- Page 52 and 53:
-----------------------------------
- Page 54 and 55:
.~------~--------------------------
- Page 56 and 57:
"Sourcebook of Criminal Justice Sta
- Page 58 and 59:
------------ - -- -"\I'Sourcebook o
- Page 60 and 61:
Sourcebook of Criminal Justice Stat
- Page 62 and 63:
Sourcebook of Criminal Justice Stat
- Page 65 and 66:
---- ~------~--~- -..---Sourcebook
- Page 67 and 68:
Sourcebook of Criminal Justice Stat
- Page 69 and 70:
.~f'ISourcebook of Criminal Justice
- Page 71 and 72:
Characteristics of the Criminal Jus
- Page 73 and 74:
f'Sourcebook of Criminal Justice St
- Page 75 and 76:
--'~--~---------------_..."'.".,..,
- Page 77 and 78:
'Sourcebook of Criminal Justice Sta
- Page 79 and 80:
------ ~---~-----~-----~Sourcebook
- Page 81 and 82:
-----------~-~---~-------Sourcebook
- Page 83 and 84:
-----~---~~~. -'""".-=-./}Character
- Page 85 and 86:
--------------------Sourcebook of C
- Page 87 and 88:
-----------------------------------
- Page 89 and 90:
[!r-·ISourcebook of Criminal Justi
- Page 91 and 92:
- _. - -------~--...;--~"-"----- --
- Page 93 and 94:
.~. ---..ot--~.....--- -- ~------_.
- Page 95 and 96:
Sourcebook of Criminal Justice Stat
- Page 97 and 98:
--""'1,- ~,.--- --_'M~II!tlT'-~'r.
- Page 99 and 100:
- -~--~--~-~~-------~----------Tabl
- Page 101 and 102:
~~--~~--~-----~ ----Sourcebook of C
- Page 103 and 104:
~-~-------------------------_--____
- Page 105 and 106:
------------Sourcebook of Criminal
- Page 107 and 108:
Sourcebook of Criminal Justice Stat
- Page 109 and 110:
Characteristics of the Criminal Jus
- Page 111 and 112:
------- -- - -- -Sourcebook of Crim
- Page 113 and 114:
"Sourcebook of Criminal Justice Sta
- Page 115 and 116:
Sourcebook of Criminal Justice Stat
- Page 117 and 118:
------"'--~ ,'~- =--Sourcebook of C
- Page 119 and 120:
Sourcebook of Criminal Justice S;at
- Page 121 and 122:
,,iSourcebook of Criminal Justice S
- Page 123 and 124:
Source: George H. Gallup, The Gallu
- Page 125 and 126:
----~------~~--~----------~--------
- Page 127 and 128:
Sourcebook of Criminal Justice Stat
- Page 129 and 130:
--------------Sourcebook of Crimina
- Page 131 and 132:
--~-~~~~---------'---Public Attitud
- Page 133 and 134:
---------------------Sourcebook of
- Page 135 and 136:
-----------------------------------
- Page 137 and 138:
----------- --~-_.------~---t]Sourc
- Page 139 and 140:
Sourcebook of Criminal Justice Stat
- Page 141 and 142:
234Sourcebook of Criminal Justice S
- Page 143 and 144:
Sourcebook of Criminal Justice Stat
- Page 145 and 146:
~---.-.-.~~~ .. ~.Sourcebook of Cri
- Page 147 and 148:
,~--------~---------------~--------
- Page 149 and 150:
-~---------i': 1r\ jI~1 Public Atti
- Page 151 and 152:
--~---------------~----------Source
- Page 153 and 154:
~-~ - -'--~-------~----~~----------
- Page 155 and 156:
~-~- ~-----------------------------
- Page 157 and 158:
· -.Figure 2.14 Attitudes toward t
- Page 159 and 160:
Sourcebook of Criminal Justice Stat
- Page 161 and 162: Sourcebook of Criminal Justice Stat
- Page 163 and 164: --"'" - -~--..--- -Sourcebook of Cr
- Page 166 and 167: .,.----------- - --" ,,jSourcebook
- Page 168 and 169: ~---~----~---" '--Sourcebook of Cri
- Page 170 and 171: Sourcebook of Criminal Justice Stat
- Page 172 and 173: ....... ,-"'-~--... ~.Sourcebook of
- Page 174 and 175: -- ..... --~.....-- -- -~ --'\,j--S
- Page 176 and 177: "~Sourcebook of Criminal Justice St
- Page 178 and 179: --~----- --~-----r\ I,I.-------. "
- Page 180 and 181: ---------------------,-------------
- Page 182 and 183: Sourcebook of Criminal Justice Stat
- Page 184 and 185: --------------------_.;e __ ... , .
- Page 186 and 187: -----_.----------------------------
- Page 188 and 189: --~--~-...---Sourcebook of Criminal
- Page 190 and 191: ----....--,-"..__._-..- ~ -- ~~ ...
- Page 192 and 193: -- ..... -~-..---=4'CI)("")CI)9:::s
- Page 194 and 195: -~-~ -----------------Sourcebook of
- Page 196 and 197: Nature and Distribution of Known Of
- Page 198 and 199: --------.-~ '-'=~~-------- -- -I1Na
- Page 200 and 201: Nature and Distribution of Known Of
- Page 202 and 203: ---------~----------------~--------
- Page 204 and 205: -------'''*'''_''' __ ,~=IW".(ISour
- Page 206 and 207: ;1INoture ond Distribution of /
- Page 208 and 209: ~~~-~----- ---- -~---~---~--~~-----
- Page 210 and 211: Sourcebook of Criminol Justice Stat
- Page 214 and 215: - ~--J."'~~~"_~ ..~F'"-_ ....Source
- Page 216 and 217: Nature and Distribution of Known Of
- Page 218 and 219: --------"Source bo 0 k of Crimi no
- Page 220 and 221: Sourcebook of Criminol Justice Stat
- Page 222 and 223: "---- ~ -------~~ -----------------
- Page 224 and 225: .------~~- --~Sourcebook of Crimina
- Page 226 and 227: 396----------- -- ~Sourcebook of Cr
- Page 228 and 229: Sourcebook of Criminal Justice Stat
- Page 230 and 231: --Agure 3.24 Rate (per 100 officers
- Page 232 and 233: 407-~------- ----Sourcebook of Crim
- Page 234 and 235: ------------- -- ~Sourcebook of Cri
- Page 236 and 237: Characteristics and Distribution of
- Page 238 and 239: ---.0lIl, - ~-.,---------- . ---Sou
- Page 240 and 241: --~----~c,Sourcebook of Criminal Ju
- Page 242 and 243: ------------ - -- ----- --------~II
- Page 244 and 245: - ----~--~\"r--. 'I[I)1Ir ri II.~\,
- Page 246 and 247: .~--,..., - -~ --..--- --~ ----~---
- Page 248 and 249: -------_ .. -Sourcebook of Criminal
- Page 250 and 251: Sourcebook of Criminal Justice Stat
- Page 252 and 253: ----.------------------------------
- Page 254 and 255: ------------ - ~"Sourcebook of Crim
- Page 256 and 257: Sourcebook of Criminal Justice Stat
- Page 258 and 259: -------- --------~------------rSour
- Page 260 and 261: -~--~......--- --------------------
- Page 262:
Sourcebook of Criminal Justice Stat
- Page 265 and 266:
---~--- ----------- ---------------
- Page 267 and 268:
~--~----------~--------------------
- Page 269 and 270:
----------- _. ---~--------~------.
- Page 271 and 272:
Sourcebook of Criminal Justice Stat
- Page 273 and 274:
------------------- ---------------
- Page 275 and 276:
--"~ ~- .... -~--,-----Sourcebook o
- Page 277 and 278:
~-~--~......--- --------~--~- - ~--
- Page 279 and 280:
."Sourcebook of Criminal Justice St
- Page 281 and 282:
Sourcebook of Criminal Justice Stat
- Page 283 and 284:
Judicial Processing of DefendantsFi
- Page 285 and 286:
Sourcebook of Criminal Justice Stat
- Page 287 and 288:
Sourcebook of Criminal Justice ;ita
- Page 289 and 290:
--- ..... - ~-..--~--------. - ---I
- Page 291 and 292:
- ~-----~----~ -~--Figure 5.9 Civil
- Page 293 and 294:
'rIlfI. '"• ""' .. t.':>\._ ;~~,
- Page 295 and 296:
."Sourcebook of Criminol Justice St
- Page 297 and 298:
---------- - -- -Sourcebook of Crim
- Page 299 and 300:
Figure 5.11 Obscenity complaints re
- Page 301 and 302:
- ----..--~Sourcebook of Criminal J
- Page 303 and 304:
Sourcebook of Criminal Justice Stat
- Page 305 and 306:
--~- ~,,------------ -- ~JUdicial P
- Page 307 and 308:
Sourcebook of Criminal Justice Stat
- Page 309 and 310:
"Sourcebook of Criminal Justice Sta
- Page 311 and 312:
Table 6.4 Level31, 1981Sourcebook o
- Page 313 and 314:
Sourcebook of Criminal Justice Stot
- Page 315 and 316:
------ --------------------~-------
- Page 317 and 318:
Sourcebook of Criminal Justice Stat
- Page 319 and 320:
'""' - .----~-- ---~---------------
- Page 321 and 322:
---.0lIl,- ~--,.--- - - - ---------
- Page 323 and 324:
Sourcebook of Criminal Justice Stat
- Page 325 and 326:
---~~--- --- - --Sourcebook of Crim
- Page 327 and 328:
Sourcebook of Criminal Justice Stat
- Page 329 and 330:
-------- ---~-Sourcebook of Crimina
- Page 331 and 332:
:Sourcebook of Criminal Justice Sta
- Page 333 and 334:
Sourcebook of Criminal Justice Stat
- Page 335 and 336:
-'•Sourcebook of Criminal Justice
- Page 337 and 338:
,-.-~------......-~-----n.~-".~" ..
- Page 339 and 340:
SourcebG,.lk of Criminal Justice St
- Page 341 and 342:
Sourcebook of Criminal Justice Stat
- Page 343 and 344:
-----------------------------------
- Page 345 and 346:
~~------r 'I,-Sourcebook of Crimina
- Page 347 and 348:
Sourcebook of Cril"":inal Justice S
- Page 349 and 350:
----------- - -- ~------~-------~--
- Page 351 and 352:
--------~~--- --- --~--- --------Na
- Page 353 and 354:
Sourcebook of Crlmlnol Justice Stat
- Page 355 and 356:
---- - --------~Sources and Referen
- Page 357 and 358:
- ---------~Expenditure and Employm
- Page 359 and 360:
AppendicesPopulation definitionsJ!f
- Page 361 and 362:
,-Sourcebook of Criminal Justice St
- Page 363 and 364:
Appendices"NJPENDIX 7Public opinion
- Page 365 and 366:
--------------~-------APPENDIX 8ABC
- Page 367 and 368:
- -~~ - -~-----~~ ----------~------
- Page 369 and 370:
------------ - -APPENDIX 14APPENDIX
- Page 371 and 372:
--~- ~-..---Estimating procedureSou
- Page 373 and 374:
------------------------~included i
- Page 375 and 376:
---~--------~--~------Sourcebook of
- Page 377 and 378:
INDEXAbortionAbuse and neglectAcqui
- Page 379 and 380:
--~--~--,,--682rCOLRTS-MARTIAL (con
- Page 381 and 382:
---....--~,..-- -- -~ --IndexJ\.RIE
- Page 383 and 384:
------- ~(ffiOSECUTIQ\J (continued)
- Page 385 and 386:
Evaluation form forSourcebook Of Cr
- Page 387 and 388:
~ .... --------r~-- - --Bureau of J
- Page 389:
-.'>(':;'~."'\-IIIi· "IfJ./II11III