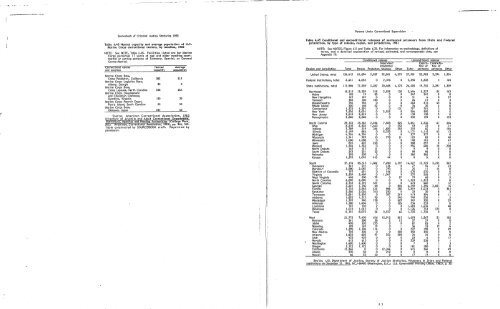
---------- ~ - ~<strong>Sourcebook</strong> <strong>of</strong> <strong>Criminal</strong> <strong>Justice</strong> <strong>Statistics</strong> <strong>1983</strong>Table 6.44 Average doily population <strong>of</strong> U.S. Army confinement and correctional facilities, byfacility, 1973-821974 1975 1976 1977 1978 1979 1980 1981 1982Facility 1973177 154 8$ 30 10 7 6 9 12 IIFort Bragg165 131 86 77 35 24 22 28 3U 41Fort Campbell II 31 39 5077 117 47 42 21 10Fort Corson135 96 55 33 31 37 49 67 56Fort !-bod II!! 29 40 54140 144 77 49 22 18 20Fort Lewis122 71 20 18 12 16 20 36 35Fort Meade 13112 16 33 7!!162 171 73 42 26 13Fort Ord42 27 13 10 8 8 13 25 21 16Fort Polk93 52 36 24 27 48 57 82 78 84Fort Riley 13 12 32 43 52Fort Benning 127 67 37 27 18Fort BlissFort DixFort GordonFort JocksonFort Knox49 42 33 21 14 10 10 7 12280 171 71 33 19 12 16 a 26 20 14125 97 53 38 20 17 19 23 30 3839 20 15 2 2 2 2 I I244 196 63 47 21 19 23 27 25 38109 19 19 21 16 18 21 30 56Fort Sill 155 4 246 21 13 7 4 7 IUFo\"t Leonord Wood 179 0I 2 3 2 I 3 2 2Fort FitzsirrmonsIU.S. Army Disciplinor',!931 1,153 1,152 1,189 1,038 818 1,022 1,315 1,4U2 1,452BarracksU.S. Army Retraining953 580 412 450 518 502 714 805 578Brigade 1,031~isoners ct Novy facility.Source: Tobie provided to sa...RCEBOO< st<strong>of</strong>f by the U.S. Deportment <strong>of</strong> Defense, Deportment <strong>of</strong>the Army.r'I,'I 1I IjI1\!l'j1iIjIIIIIIt!Table 6.45 Normal capacity and average population <strong>of</strong> U.S.Army correctional centers, by location, 1982NJTE: Data have been collected from the organizations oragencies through a moil survey. Facilities listed are formilitary personnel 17 years <strong>of</strong> age and older. "Normalcapacity" is the number <strong>of</strong> inmates the facility was designedto hold.Correctional centerand locationNormalcapacityU.S. Disciplinary Barracks,Fort Lea,'enworth, Kansas 1,500Fort BtmningConfinement Facility,Fort Benning, Georgia 62Fort GordonConfinement Facility,Fort Gordon, Georgia 60Fort Knox AreaConfinement Facility,Fort Knox, Kentucky 50Fod SillConfinement Facility,Fort Sill, Oklahoma 70U.S. Army Retraining Brigade,Fort Riley, Kansas 1,000Fort CampbellConfinement Facility,Fort Campbell, Kentucky 60Fort CarsonCcnfinement Facility,Fort Corson, Colorado 62Fort f-bodConfinement Facility,Fort f-bod, Texas 75Fort LewisConfinement Facility,Fort LeWis, Washington 50Fort MeadeConfinement Facility,Fort George G. Meade,Maryland 55Fort OrdConfinement Facility,Fort Ord, California 100Fort PolkConfinement Facility,Fort Polk, Louisiana 34Fort RichardsonConfinement Facility,Fort Richardson, Alaska 25Fort RileyConfinement Facility,Fort Riley, Kansas 96U.S. Eighth ArmyConfinement Facility,Camp Humphries, Korea 50BerlinConfinement Facility,Berlin, GermanyIISETAFConfinement Facility,Camp Darley, Italy 4MannheimConfinement Facility,Mannhelm, Germany 156Fort ClaytonConfinement Facility,Fort Clayton, Panama 19permission.Persons Under Correctional SupervisionAverage populationMole Female1,464 146148 045 066 2531 II3554 378 046 040 589 3II 028 079 4408 0o182 46 0Table 6.46 Normal capacity and average population <strong>of</strong> U.S.Air Force correctional center, 1981NJTE: See NOTE, Table 6.45. The correctional center listedincludes facilities for confinement <strong>of</strong> minimum, medium, andmaximum custody grades. "Normal capacity" is the number <strong>of</strong>inmates the facility was designed to hold.Correctional centerNormalcapacity3320th Correction and RehabilitationSquadron, Lowry Air Force Base,Colorado 200AveragepapulationSource: American Correctional Association, <strong>1983</strong>Director <strong>of</strong> Juveni Ie and Adult Correctional De artme;;tSInstitutions A encies and PafcJin Authorities College Par ,Md.: American Correctional Association, 8, p. 344. Tableconstructed by SaRCEBOO< staff. Reprinted by permission.Table 6.47 Normal capacity and average population <strong>of</strong> U.S.Navy correctional centers, by location, 1982NJTE: See NJTE, Table 6.45. The Novy also operates other smallcorrectional '1:.~nters and detention spaces in the United Statesand d'verseas. All facilities are for Naval personnel 17 years <strong>of</strong>age and older awaiting court-martial or serving court-martialsentences. "Normal capacity" Is the number <strong>of</strong> inmates thefacility was designed to hold.Correctional centerand locationNoval Station,Long Beach, CaliforniaNovo I Station,Son Diego, CaliforniaNoval Station, Treasure Island,Son Francisco, CaliforniaNovo I Submarine Bose,New London, ConnecticutNovo I Air Station,Jacksonville, FloridaNovo I Air Station,Pensacola, FloridaNoval Station,Pearl f-brbor, Howai iNoval Administrative Command,Great Lakes, IllinoisNova I Station,Philadelphia, PennsylVaniaNova I Education andTraining Center,Newpart, Rhode IslandNovo I Station,Charleston, South CarolinaNova I Air Station,Millington, TennesseeNoval Air Station,Corpus Christi, TexasNoval Station,Norfolk, VirginiaNova I Station,Seattle, WashingtonNaval Station,Guantanamo Bay, CubaNoval Station,GuamFleet Activities,Yokosuka, JapanNova I Base,Sub)c Bay, PhilippinesNova I Station,Roosevelt Roads, Puerto RicoNoval Station,Rota, SpainNormalcapacity341871482050728217021075956!!6528759242349561015103------...--....~ ''''''-Averagepapulation23170III1464465413014332825735264626144048720
<strong>Sourcebook</strong> <strong>of</strong> <strong>Criminal</strong> <strong>Justice</strong> <strong>Statistics</strong> <strong>1983</strong>Table 6.48 Normal capo!c:ity and average population <strong>of</strong> U.S.Marine Corps correctil.onal centers, by location, 1982!\oTE: See !\oTE, Table ,1.45. Facilities listed are for MarineCorps personnel I 7 yl~ars <strong>of</strong> age alld older awaiting courtmartialor serving sentence <strong>of</strong> Summary, Special, or GeneralCourts-Martial.Persons Und-:.r Correctional SupervisionTable 6.49 Conditional and unconditional releases <strong>of</strong> sentenced prisoners from Stote and Federaljurisdiction, by type <strong>of</strong> release, region, and jurisdiction, 1981!\oTE: See !\oTES, Figure 6.5 and Table 6.22. For Information on methodology, definitions <strong>of</strong>terms, and a detailed explanation <strong>of</strong> revised, estimated, and noncomparable data, seeAppendix 19.Conditional releaseUnconditional releaseSupervisedExpira- Commuta-Correctional center I'brrnal AVerage mandatory tion <strong>of</strong> tlon <strong>of</strong>and location ca2S!clt:! population Region ond lurlsdlctlon Total Porole Probation releases Other Totol sentence sentence OtherMarine Corps Base,United States, total 124,415 81,894 5,287 32,861 4,373 27,901 22,983 3,394 1,524Camp Pendleton, Califorl1ia 382 215Marine Corps Logistics Bor.e,Federal Institutions, total 6,431 4,055 0 2,376 0 3,396 3,228 3 165Albony, Georgia 30 2Marine Corps Base,State Institutions, total 117,984 77,839 5,287 30,485 4,373 24,505 19,755 3,391 1,359Camp Lejeune, North COl'olina 358 244Marine Corps DevelopmentI'brtheast 16,315 13,329 315 2,535 136 2,444 2,227 54 163and Education Command,Maine 102 19 83 0 0 247 247 0 0Quantico, Virginia 150 30 New Hcrnpshire 167 167 0 0 0 31 4 0 27Marine Corps Recruit Depc,'t,Vermont 305 120 180 0 5 24 21 0 3Parris Island, South Carolina 55 55Massachusetts 796 796 0 0 0 263 215 4Q 0Marine Corps Base,Rhode Island 200 148 52 0 0 34 30 4 0Okinawa, Japan 237 45 Connecticut 1,522 1,391 0 0 131 79~ 791 2 0New York 7,536 5,001 0 2,535 0 59U 590 0 (lSource: American Correctional Association, <strong>1983</strong>New Jersey 2,819 2,819 0 0 0 130 130 0 0~Y <strong>of</strong> Juvenile and Adult Correctional De artmentsPennsylvania 2,868 2,86B 0 0 0 332 199 0 133Institutiuns, Agencies and taro 109 \!! ontles 0 ege or,Md.: ArTlerican. Correcticlnal ASsociation, <strong>1983</strong>), pp. 344, 345.I'brth Central 29,722 18,565 2,494 7,838 825 3,841 3,236 61 544Table constructed by SOL..RCEBOOK staff. Reprinted byOhio 8,518 6,503 1,463 0 552 53 22 0 31Indiana 2,7B9 519 344 1,683 243 210 66 0 144permis~,on.illinois 6,199 866 0 5,333 0 1,171 I, I 15 43 13Michigan 4,754 4,754 0 0 0 377 377 0 0Wisconsin 1,741 929 13 778 21 125 85 0 40Minnesota 1,0BI3 1,088 0 0 0 148 101 0 47Iowa 835 607 228 0 0 308 297 0 IIMissouri 1,554 1,552 0 0 2 956 680 18 258I'brth Dakota 165 147 II 0 7 9 9 0 0South Dakota 243 221 22 0 0 98 98 0 0Nebraska 303 303 0 0 0 386 386 0 0I Kansas 1,533 1,076 413 44 0 0 X X XSouth 5tII l , 174 3B,515 1,862 7,200 2,5')7 16,527 12,725 3,255 547,j Delaware 367 231 0 136 0 77 54 0 23u Marylar.-i 2,880 2,OB7 0 793 0 25 II 14 0District ,.f Columbia 797 691 0 106 0 670 670 0 0Virginia 3,539 2,489 0 1,047 3 275 258 0 17West Virginia 406 300 79 0 27 73 68 0 51( I'brth Carolina 6,890 6,890 0 0 0 1,323 1,323 0 0ISouth .Carolina 2,752 2,195 557 0 0 673 660 I 1211~fI!1 !,\ '\IIGeorgia 2,601 1,750 48 0 803 4,259 1,394 2,851 14Florida 5,735 3,855 614 984 282 3,019 2,633 5 381Kentucky 2,586 2,026 310 250 0 33 30 0 3Tennessee 2,881 2,305 0 357 219 4!3 394 8 'IIAlabama 1,832 1,512 78 0 242 540 536 I 3Mississippi 1,707 940 138 0 629 349 320 0 29Arkansas 1,7BO 1,454 0 0 326 254 253 I 0Louisiana 707 705 2 0 0 1,683 1,634 I 48Oklahoma 1,013 1,013 0 0 0 1,126 753 373 0Texas 11,101 8,072 36 3,527 66 1,735 1,734 0 IWest 21,773 7,430 616 12,912 815 1,693 1,567 21 105Montana 361 288 58 2 13 57 57 0 0Idaho 498 203 295 0 0 87 85 0 2Wyoming 189 169 19 0 I 56 33 19 4Colorado 1,298 1,184 114 0 0 227 198 0 29New Mexico 705 502 0 0 203 350 350 0 0Arizona 1,832 805 97 332 598 34 34 0 0Utah 433 433 0 0 0 23 6 0 17Nevada 613 613 0 0 0 239 238 0 IWashington 1,400 1,400 0 0 0 7 3 I 3Oregon 1,722 1,722 0 0 0 181 180 I 0California 12,366 0 0 12,366 0 415 366 0 49Alaska 270 58 0 212 0 0 X X XHawaii 86 53 33 0 0 17 17 0 0Source: U.S. Department <strong>of</strong> <strong>Justice</strong>, <strong>Bureau</strong> <strong>of</strong> <strong>Justice</strong> <strong>Statistics</strong>, Prisoners in State and FederalInstitutions on December 31, 1981, NCJ-86485 (Washington, D.C.: U.S. Government Printing Office, 19B3), p. 30.5 3
- Page 1 and 2:
u.s. Department of JusticeBureau of
- Page 3 and 4:
________ n~'·••SOURCEBOOKOF CR
- Page 5 and 6:
Sourcebook of Criminal Justice Stat
- Page 7 and 8:
Figure B An overview of detelnclude
- Page 9 and 10:
--------- - --Svurcebook of Crimina
- Page 11 and 12:
- - .. "-- - ~------~ ------------C
- Page 13 and 14:
Figure3.12 Estimated rate (per 100,
- Page 15 and 16:
TableFig. 2.6 Respondents taking pr
- Page 17 and 18:
Sourcebook of Criminal Justice Stat
- Page 19 and 20:
---------- - -- ~------------------
- Page 21 and 22:
- ...... - ~r---~---------~--------
- Page 24 and 25:
------------- - ~------~-----~-----
- Page 26 and 27:
Sourcebook of Criminal Justice Stat
- Page 28 and 29:
--------- -' -- - -'-- ----~-------
- Page 30 and 31:
---- -- --~------~ ---rl.Sourcebook
- Page 32 and 33:
~~---------- ---~----------~-------
- Page 34 and 35:
-------------- - ---~---~--------~-
- Page 36 and 37:
~~~~~~~---- - -- -Sourcebook of Cri
- Page 38 and 39:
----.... ....--.-. ~"'-.~Sourcebook
- Page 40 and 41:
(Sourcebook of Criminal Justice Sta
- Page 42 and 43:
-----~---------------------.-'-----
- Page 44 and 45:
Table 1.13 Number and rateOct. 31,
- Page 46 and 47:
~-~- ~-...--~ -- ~ ---,~-------. -.
- Page 48 and 49:
-- ..... -,-.--..-... ~~----r; __ '
- Page 50 and 51:
---..0lIl, - -~,..--- -- - - ----~-
- Page 52 and 53:
-----------------------------------
- Page 54 and 55:
.~------~--------------------------
- Page 56 and 57:
"Sourcebook of Criminal Justice Sta
- Page 58 and 59:
------------ - -- -"\I'Sourcebook o
- Page 60 and 61:
Sourcebook of Criminal Justice Stat
- Page 62 and 63:
Sourcebook of Criminal Justice Stat
- Page 65 and 66:
---- ~------~--~- -..---Sourcebook
- Page 67 and 68:
Sourcebook of Criminal Justice Stat
- Page 69 and 70:
.~f'ISourcebook of Criminal Justice
- Page 71 and 72:
Characteristics of the Criminal Jus
- Page 73 and 74:
f'Sourcebook of Criminal Justice St
- Page 75 and 76:
--'~--~---------------_..."'.".,..,
- Page 77 and 78:
'Sourcebook of Criminal Justice Sta
- Page 79 and 80:
------ ~---~-----~-----~Sourcebook
- Page 81 and 82:
-----------~-~---~-------Sourcebook
- Page 83 and 84:
-----~---~~~. -'""".-=-./}Character
- Page 85 and 86:
--------------------Sourcebook of C
- Page 87 and 88:
-----------------------------------
- Page 89 and 90:
[!r-·ISourcebook of Criminal Justi
- Page 91 and 92:
- _. - -------~--...;--~"-"----- --
- Page 93 and 94:
.~. ---..ot--~.....--- -- ~------_.
- Page 95 and 96:
Sourcebook of Criminal Justice Stat
- Page 97 and 98:
--""'1,- ~,.--- --_'M~II!tlT'-~'r.
- Page 99 and 100:
- -~--~--~-~~-------~----------Tabl
- Page 101 and 102:
~~--~~--~-----~ ----Sourcebook of C
- Page 103 and 104:
~-~-------------------------_--____
- Page 105 and 106:
------------Sourcebook of Criminal
- Page 107 and 108:
Sourcebook of Criminal Justice Stat
- Page 109 and 110:
Characteristics of the Criminal Jus
- Page 111 and 112:
------- -- - -- -Sourcebook of Crim
- Page 113 and 114:
"Sourcebook of Criminal Justice Sta
- Page 115 and 116:
Sourcebook of Criminal Justice Stat
- Page 117 and 118:
------"'--~ ,'~- =--Sourcebook of C
- Page 119 and 120:
Sourcebook of Criminal Justice S;at
- Page 121 and 122:
,,iSourcebook of Criminal Justice S
- Page 123 and 124:
Source: George H. Gallup, The Gallu
- Page 125 and 126:
----~------~~--~----------~--------
- Page 127 and 128:
Sourcebook of Criminal Justice Stat
- Page 129 and 130:
--------------Sourcebook of Crimina
- Page 131 and 132:
--~-~~~~---------'---Public Attitud
- Page 133 and 134:
---------------------Sourcebook of
- Page 135 and 136:
-----------------------------------
- Page 137 and 138:
----------- --~-_.------~---t]Sourc
- Page 139 and 140:
Sourcebook of Criminal Justice Stat
- Page 141 and 142:
234Sourcebook of Criminal Justice S
- Page 143 and 144:
Sourcebook of Criminal Justice Stat
- Page 145 and 146:
~---.-.-.~~~ .. ~.Sourcebook of Cri
- Page 147 and 148:
,~--------~---------------~--------
- Page 149 and 150:
-~---------i': 1r\ jI~1 Public Atti
- Page 151 and 152:
--~---------------~----------Source
- Page 153 and 154:
~-~ - -'--~-------~----~~----------
- Page 155 and 156:
~-~- ~-----------------------------
- Page 157 and 158:
· -.Figure 2.14 Attitudes toward t
- Page 159 and 160:
Sourcebook of Criminal Justice Stat
- Page 161 and 162:
Sourcebook of Criminal Justice Stat
- Page 163 and 164:
--"'" - -~--..--- -Sourcebook of Cr
- Page 166 and 167:
.,.----------- - --" ,,jSourcebook
- Page 168 and 169:
~---~----~---" '--Sourcebook of Cri
- Page 170 and 171:
Sourcebook of Criminal Justice Stat
- Page 172 and 173:
....... ,-"'-~--... ~.Sourcebook of
- Page 174 and 175:
-- ..... --~.....-- -- -~ --'\,j--S
- Page 176 and 177:
"~Sourcebook of Criminal Justice St
- Page 178 and 179:
--~----- --~-----r\ I,I.-------. "
- Page 180 and 181:
---------------------,-------------
- Page 182 and 183:
Sourcebook of Criminal Justice Stat
- Page 184 and 185:
--------------------_.;e __ ... , .
- Page 186 and 187:
-----_.----------------------------
- Page 188 and 189:
--~--~-...---Sourcebook of Criminal
- Page 190 and 191:
----....--,-"..__._-..- ~ -- ~~ ...
- Page 192 and 193:
-- ..... -~-..---=4'CI)("")CI)9:::s
- Page 194 and 195:
-~-~ -----------------Sourcebook of
- Page 196 and 197:
Nature and Distribution of Known Of
- Page 198 and 199:
--------.-~ '-'=~~-------- -- -I1Na
- Page 200 and 201:
Nature and Distribution of Known Of
- Page 202 and 203:
---------~----------------~--------
- Page 204 and 205:
-------'''*'''_''' __ ,~=IW".(ISour
- Page 206 and 207:
;1INoture ond Distribution of /
- Page 208 and 209:
~~~-~----- ---- -~---~---~--~~-----
- Page 210 and 211:
Sourcebook of Criminol Justice Stat
- Page 212 and 213:
~ ---~ ---------- - ---Sout!:eboci<
- Page 214 and 215:
- ~--J."'~~~"_~ ..~F'"-_ ....Source
- Page 216 and 217:
Nature and Distribution of Known Of
- Page 218 and 219:
--------"Source bo 0 k of Crimi no
- Page 220 and 221:
Sourcebook of Criminol Justice Stat
- Page 222 and 223:
"---- ~ -------~~ -----------------
- Page 224 and 225:
.------~~- --~Sourcebook of Crimina
- Page 226 and 227:
396----------- -- ~Sourcebook of Cr
- Page 228 and 229:
Sourcebook of Criminal Justice Stat
- Page 230 and 231:
--Agure 3.24 Rate (per 100 officers
- Page 232 and 233:
407-~------- ----Sourcebook of Crim
- Page 234 and 235:
------------- -- ~Sourcebook of Cri
- Page 236 and 237:
Characteristics and Distribution of
- Page 238 and 239:
---.0lIl, - ~-.,---------- . ---Sou
- Page 240 and 241:
--~----~c,Sourcebook of Criminal Ju
- Page 242 and 243:
------------ - -- ----- --------~II
- Page 244 and 245:
- ----~--~\"r--. 'I[I)1Ir ri II.~\,
- Page 246 and 247:
.~--,..., - -~ --..--- --~ ----~---
- Page 248 and 249:
-------_ .. -Sourcebook of Criminal
- Page 250 and 251:
Sourcebook of Criminal Justice Stat
- Page 252 and 253:
----.------------------------------
- Page 254 and 255:
------------ - ~"Sourcebook of Crim
- Page 256 and 257:
Sourcebook of Criminal Justice Stat
- Page 258 and 259:
-------- --------~------------rSour
- Page 260 and 261:
-~--~......--- --------------------
- Page 262:
Sourcebook of Criminal Justice Stat
- Page 265 and 266:
---~--- ----------- ---------------
- Page 267 and 268:
~--~----------~--------------------
- Page 269 and 270:
----------- _. ---~--------~------.
- Page 271 and 272:
Sourcebook of Criminal Justice Stat
- Page 273 and 274:
------------------- ---------------
- Page 275 and 276:
--"~ ~- .... -~--,-----Sourcebook o
- Page 277 and 278:
~-~--~......--- --------~--~- - ~--
- Page 279 and 280:
."Sourcebook of Criminal Justice St
- Page 281 and 282: Sourcebook of Criminal Justice Stat
- Page 283 and 284: Judicial Processing of DefendantsFi
- Page 285 and 286: Sourcebook of Criminal Justice Stat
- Page 287 and 288: Sourcebook of Criminal Justice ;ita
- Page 289 and 290: --- ..... - ~-..--~--------. - ---I
- Page 291 and 292: - ~-----~----~ -~--Figure 5.9 Civil
- Page 293 and 294: 'rIlfI. '"• ""' .. t.':>\._ ;~~,
- Page 295 and 296: ."Sourcebook of Criminol Justice St
- Page 297 and 298: ---------- - -- -Sourcebook of Crim
- Page 299 and 300: Figure 5.11 Obscenity complaints re
- Page 301 and 302: - ----..--~Sourcebook of Criminal J
- Page 303 and 304: Sourcebook of Criminal Justice Stat
- Page 305 and 306: --~- ~,,------------ -- ~JUdicial P
- Page 307 and 308: Sourcebook of Criminal Justice Stat
- Page 309 and 310: "Sourcebook of Criminal Justice Sta
- Page 311 and 312: Table 6.4 Level31, 1981Sourcebook o
- Page 313 and 314: Sourcebook of Criminal Justice Stot
- Page 315 and 316: ------ --------------------~-------
- Page 317 and 318: Sourcebook of Criminal Justice Stat
- Page 319 and 320: '""' - .----~-- ---~---------------
- Page 321 and 322: ---.0lIl,- ~--,.--- - - - ---------
- Page 323 and 324: Sourcebook of Criminal Justice Stat
- Page 325 and 326: ---~~--- --- - --Sourcebook of Crim
- Page 327 and 328: Sourcebook of Criminal Justice Stat
- Page 329 and 330: -------- ---~-Sourcebook of Crimina
- Page 331: :Sourcebook of Criminal Justice Sta
- Page 335 and 336: -'•Sourcebook of Criminal Justice
- Page 337 and 338: ,-.-~------......-~-----n.~-".~" ..
- Page 339 and 340: SourcebG,.lk of Criminal Justice St
- Page 341 and 342: Sourcebook of Criminal Justice Stat
- Page 343 and 344: -----------------------------------
- Page 345 and 346: ~~------r 'I,-Sourcebook of Crimina
- Page 347 and 348: Sourcebook of Cril"":inal Justice S
- Page 349 and 350: ----------- - -- ~------~-------~--
- Page 351 and 352: --------~~--- --- --~--- --------Na
- Page 353 and 354: Sourcebook of Crlmlnol Justice Stat
- Page 355 and 356: ---- - --------~Sources and Referen
- Page 357 and 358: - ---------~Expenditure and Employm
- Page 359 and 360: AppendicesPopulation definitionsJ!f
- Page 361 and 362: ,-Sourcebook of Criminal Justice St
- Page 363 and 364: Appendices"NJPENDIX 7Public opinion
- Page 365 and 366: --------------~-------APPENDIX 8ABC
- Page 367 and 368: - -~~ - -~-----~~ ----------~------
- Page 369 and 370: ------------ - -APPENDIX 14APPENDIX
- Page 371 and 372: --~- ~-..---Estimating procedureSou
- Page 373 and 374: ------------------------~included i
- Page 375 and 376: ---~--------~--~------Sourcebook of
- Page 377 and 378: INDEXAbortionAbuse and neglectAcqui
- Page 379 and 380: --~--~--,,--682rCOLRTS-MARTIAL (con
- Page 381 and 382: ---....--~,..-- -- -~ --IndexJ\.RIE
- Page 383 and 384:
------- ~(ffiOSECUTIQ\J (continued)
- Page 385 and 386:
Evaluation form forSourcebook Of Cr
- Page 387 and 388:
~ .... --------r~-- - --Bureau of J
- Page 389:
-.'>(':;'~."'\-IIIi· "IfJ./II11III